RNA neoantigen vaccines prime long-lived CD8+ T cells in pancreatic cancer – Nature.com
Thank you for visiting nature.com. You are using a browser version with limited support for CSS. To obtain
the best experience, we recommend you use a more up to date browser (or turn off compatibility mode in
Internet Explorer). In the meantime, to ensure continued support, we are displaying the site without styles
and JavaScript.Advertisement
Nature
(2025)Cite this article
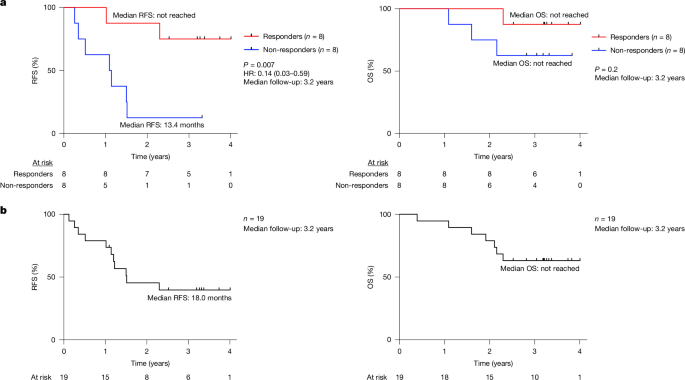
155 AltmetricMetrics detailsA fundamental challenge for cancer vaccines is to generate long-lived functional T cells that are specific for tumour antigens. Here we find that mRNA–lipoplex vaccines against somatic mutation-derived neoantigens may solve this challenge in pancreatic ductal adenocarcinoma (PDAC), a lethal cancer with few mutations. At an extended 3.2-year median follow-up from a phase 1 trial of surgery, atezolizumab (PD-L1 inhibitory antibody), autogene cevumeran1 (individualized neoantigen vaccine with backbone-optimized uridine mRNA–lipoplex nanoparticles) and modified (m) FOLFIRINOX (chemotherapy) in patients with PDAC, we find that responders with vaccine-induced T cells (n = 8) have prolonged recurrence-free survival (RFS; median not reached) compared with non-responders without vaccine-induced T cells (n = 8; median RFS 13.4 months; P = 0.007). In responders, autogene cevumeran induces CD8+ T cell clones with an average estimated lifespan of 7.7 years (range 1.5 to roughly 100 years), with approximately 20% of clones having latent multi-decade lifespans that may outlive hosts. Eighty-six percent of clones per patient persist at substantial frequencies approximately 3 years post-vaccination, including clones with high avidity to PDAC neoepitopes. Using PhenoTrack, a novel computational strategy to trace single T cell phenotypes, we uncover that vaccine-induced clones are undetectable in pre-vaccination tissues, and assume a cytotoxic, tissue-resident memory-like T cell state up to three years post-vaccination with preserved neoantigen-specific effector function. Two responders recurred and evidenced fewer vaccine-induced T cells. Furthermore, recurrent PDACs were pruned of vaccine-targeted cancer clones. Thus, in PDAC, autogene cevumeran induces de novo CD8+ T cells with multiyear longevity, substantial magnitude and durable effector functions that may delay PDAC recurrence. Adjuvant mRNA–lipoplex neoantigen vaccines may thus solve a pivotal obstacle for cancer vaccination.We previously reported1 early clinical and immunologic results of an investigator-initiated, phase 1 trial of adjuvant sequential anti-PD-L1 (atezolizumab, single pre-vaccination dose), followed by 8 intravenous priming doses of an individualized uridine-based mRNA neoantigen vaccine (autogene cevumeran; containing up to 20 major histocompatibility complex class I (MHCI) and class II (MHCII) restricted neoantigens against predominantly somatic passenger mutations administered 3 weeks after atezolizumab), mFOLFIRINOX (12 cycles) and a single vaccine boost dose (Extended Data Fig. 1a) in 19 patients with surgically resected PDAC (the safety-evaluable cohort comprised 16 vaccinated patients and 3 atezolizumab-treated patients). At a median follow-up of 1.5 years, in 8 out of the 16 vaccinated patients (biomarker-evaluable cohort), autogene cevumeran induced high-magnitude, polyfunctional neoantigen-specific CD8+ effector T cells that correlated with delayed PDAC recurrence1. Here we double the clinical and immunologic follow-up time to probe whether vaccine-induced CD8+ T cells: (1) durably correlate with delayed PDAC recurrence; (2) persist long term as putative memory T cells; and (3) retain effector function long term.In the biomarker-evaluable cohort1, at a median follow-up of 3.2 years (range 2.3–4.0 years), the 8 patients with vaccine-induced high-magnitude neoantigen-specific T cells determined by ex vivo IFNγ ELISpot1 (responders) had a median RFS that was not reached (Fig. 1a, left). By contrast, the 8 patients without vaccine-induced T cells (non-responders) had a median RFS of 13.4 months (P = 0.007; hazard ratio = 0.14, 95% confidence interval 0.03–0.59; Fig. 1a, left). The effect size between vaccine responders and non-responders was similar to the observed effect size at 1.5-year median follow-up1, including by landmark analysis to exclude a time-to-response bias (Extended Data Fig. 1b, left). Consistent with our previous findings that vaccine responders were not merely enriched in patients responding to atezolizumab or patients with better prognosis1, atezolizumab immune response (Methods) and tumour size did not correlate with delayed recurrence (Extended Data Fig. 1b, middle and right). We previously reported1 equivalent clinicopathologic prognostic features and comparable immune competence throughout the study period in responders and non-responders, with similar humoral and cellular immunity to concurrent unrelated mRNA vaccination (SARS-CoV-2). Median overall survival (OS) was not reached in responders or non-responders (Fig. 1a, right) at extended follow-up. In the safety-evaluable cohort, the median RFS was 18.0 months, and median OS was not reached (Fig. 1b). Thus, autogene cevumeran response may durably correlate with delayed PDAC recurrence.a, RFS and OS stratified by vaccine response in the biomarker-evaluable cohort. b, RFS and OS in the safety-evaluable cohort. HR, hazard ratio, with 95% confidence interval. Black tick marks indicate censorship points. n is the number of individual patients; P values by two-tailed log-rank test. Numbers of at-risk patients are shown below the graphs.To investigate whether vaccine-induced T cells persist, we traced the origin and longevity of vaccine-induced T cell clones in all responders (Fig. 2a). To do so, we applied CloneTrack1, which utilizes T cell receptor (TCR) Vβ sequencing of peripheral blood before and after vaccination to detect and trace high-magnitude vaccine-induced T cell clones (Methods). We previously reported1 that in responders, CloneTrack-identified clones are nearly all CD8+ T cells and include CD8+ T cells specific to the subset of vaccine neoantigens that trigger positive ex vivo IFNγ ELISpot responses post-priming (25 of 108 vaccine neoantigens in 8 responders were ELISpot-positive1; Fig. 2b, top).a, Analysed T cell clones in tissues and blood. Total includes all blood T cells and clones; anti-PD-L1 and vaccine clones identified by CloneTrack. Top right, trajectory of T cell clones from patient 1. Anti-PD-L1, atezolizumab; chemo, mFOLFIRINOX; vaccine prime and boost doses, autogene cevumeran. b, Top left, longitudinal aggregate percentage of vaccine-induced clones in responders. Coloured rectangles indicate times of surgery, atezolizumab, vaccination and mFOLFIRINOX; asterisk (*) indicates the altered treatment sequence for patient 14. The horizontal dashed line shows the threshold for clone detection. Top right, number of neoantigens (NAs) with validated neoantigen-specific clones. Bottom, percentage of clones mapped to ELISpot-positive (ELISpot+) neoantigens (left) and induced by vaccine prime and boost doses (right). c, Estimated clone lifespan in all (top left) and individual (bottom) patients. Bottom, the red shaded region indicates the three-year historical PDAC recurrence window; median RFS is the historical post-surgery PDAC RFS. Top right, observed versus estimated clone survival. No boost lifespans are shown for 14 clones owing to absent boost or clones. d, Left, top clone lifespans in four patients with highest-longevity clones. The dotted line indicates ten years post-vaccination. Right, percentage of clones per patient that persist two years or more post-vaccination (persistent clones). Patient 25 died less than 2 years post-vaccination. e, Last immunologic follow-up (left; median 2.95 years post-vaccination) and number and aggregate percentage of clones post-priming (all patients) and at last follow-up (patients with persistent clones) (right). f, Percentage of persistent and non-persistent clones at boost in n = 6 boosted patients among clones (top) and among all blood T cells (bottom). g, Top, percentage of tissue T cells containing treatment clones. Bottom, percentage of treatment clones contained in tissues. n is the number of tissue T cells (top) and treatment-induced clones (bottom). h, Percentage of treatment clones in peripheral blood present (pre-existing) or absent (de novo) in tissues pre-treatment (top) and associated clone sizes (bottom). All treatment-induced clones were identified by CloneTrack. Pre-tx, pre-treatment. n is the number of clones, cells or patients. P values by two-tailed Mann–Whitney test (c, h, bottom), two-tailed Wilcoxon matched-pairs signed rank test (f, bottom) and two-sided chi-squared test (h, top).Source DataApplying CloneTrack from pre-vaccination to approximately 4 years post-vaccination (5.47 million clones, 9.95 million cells in 131 samples across 26 timepoints; Fig. 2a) across all 8 responders, we identify that vaccines induce 79 T cell clones post-priming (‘CloneTrack clones’; Fig. 2b, top) with multiple clones in all patients (Extended Data Fig. 2a) and no new boost-induced clones in the 7 responders who received a boost dose (Fig. 2b, bottom and Extended Data Fig. 2b). By mapping cognate clones to all 25 ELISpot-positive vaccine neoantigens, we find that 29 out of 79 (37%) CloneTrack clones in 7 out of 8 responders are ELISpot-positive vaccine neoantigen-specific CD8+ T cells (Fig. 2b, bottom and Extended Data Fig. 3a–c; the remaining 50 CloneTrack clones were unmapped), including 15 clones in 5 responders with confirmed specificity to vaccine neoantigens by TCR cloning and minimal neoepitope mapping (Extended Data Fig. 3a–c). Although CloneTrack clones peaked with variable numbers of vaccine doses (Extended Data Fig. 4a) to different magnitudes (Extended Data Fig. 4b), 77% of CloneTrack clones reached peak expansion with 6 or fewer priming doses (Extended Data Fig. 4a), with individual clones expanding approximately 100-fold or more (Extended Data Fig. 4c) to a median peak percentage of 0.2% of all peripheral T cells (Extended Data Fig. 4d, top). Thus, in patients with PDAC, autogene cevumeran priming doses, but not boost, induce high-magnitude T cell clones.Next, to examine whether CloneTrack clones can persist long term despite patients receiving mFOLFIRINOX immediately after priming doses, we longitudinally traced contraction rates of clones in peripheral blood over time. With deep longitudinal sampling of clones (Fig. 2a), we can accurately fit a standard exponential function to the observed clonal decay dynamics (Extended Data Fig. 4e, top), and thus estimate the half-life and lifespan (time from peak frequency to below detection threshold; Methods) of each clone.After vaccine priming, CloneTrack clones had an estimated median lifespan of 1.1 years (range 0.3 to approximately 100 years; Fig. 2c, top left), with a median half-life of approximately 40 days (Extended Data Fig. 4d, bottom). Notably, a single vaccine boost markedly extended estimated clone lifespan sevenfold to a median lifespan of 7.7 years, with lifespans ranging from 1.5 to 100 years (or possibly more than approximately 100 years; Methods) (Fig. 2c, top left; median half-life 297 days; Extended Data Fig. 4d). Thus, post-boost, in 5 of 7 patients, median estimated clone lifespans exceeded the 3-year post-surgery window where the majority (approximately 80%) of patients with PDAC historically recur2,3,4 (Fig. 2c, bottom). Remarkably, in 4 out of 7 boosted patients, several clones (accounting for 30% (n = 20 out of 65) of all observed clones post-boost) had estimated lifespans that surpassed a decade (Fig. 2d, left). Peak expansion frequency correlated with clone lifespan (as expected from exponential decay) but not with half-life (Extended Data Fig. 4f). Additionally, CloneTrack clones that expanded with only one other clone had approximately sevenfold longer lifespan (post-prime) compared with clones that co-expanded with multiple clones (Extended Data Fig. 4g), which suggests that clone lifespan may increase with fewer competing clones. Clone lifespans were marginally longer in patients with polytopic (multiple immunogenic vaccine neoantigens) compared with monotopic (single immunogenic vaccine neoantigen) responses post-prime, but were similar post-boost (Extended Data Fig. 4h). Finally, CloneTrack clone lifespans reflect bona fide features of neoantigen-specific clones, as CloneTrack clones experimentally validated as specific for a neoantigen included in the vaccine (neoantigen-specific; Extended Data Fig. 3a,b) exhibited comparable half-lives and lifespans to other CloneTrack clones (Extended Data Fig. 4i).To corroborate estimated clone lifespans with observed lifespans, we next examined whether CloneTrack clones persisted in the peripheral blood over time. Consistent with accurate exponential fits over the observed time frame (Extended Data Fig. 4e, bottom), estimated clone lifespan in responders closely correlated with observed lifespan (Fig. 2c, top right). Additionally, in the 7 evaluable patients with immunologic follow-up extending beyond 2 years post-vaccination (median immunologic follow-up 2.95 years post-vaccination), 86% (median) of CloneTrack clones (Fig. 2d, right) persisted to occupy substantial fractions of all blood T cells (median 0.07%), including as high as 1.1% approximately 3.8 years post-vaccination (Fig. 2e). In boosted patients, of CloneTrack clones that persisted 2 years post-vaccination (persistent clones; n = 6 patients), 87% were present at the time of boost, whereas 64% of non-persistent clones had disappeared from circulation before boost administration (Fig. 2f). Persistent clones trended to higher generation probabilities5 (Pgen; Extended Data Fig. 5a), an estimate of preferential skewing of the human repertoire to generate specific TCRs through VDJ recombination, suggesting that compared with non-persistent clones, persistent clones may contain TCRs with higher likelihood of generation. Notably, vaccines did not co-expand clones that shared TCR Vβ specificity groups6 with CloneTrack clones (Extended Data Fig. 5b,c). In sum, autogene cevumeran induces multiple CD8+ T cell clones that persist long term in patients with PDAC, with latent lifespans that exceed the PDAC recurrence window and select clones that may outlive the host.To probe the origin of long-lived CloneTrack clones, we used TCR Vβ sequencing to comprehensively search for CloneTrack clones in pre-vaccination host blood and tissues (tumours, tumour-draining lymph nodes (DLNs) and tumour-adjacent non-lymphoid tissues; 736,000 clones, 36 samples) in the 8 responders (Fig. 2a).We detected only 2 cells of 2 CloneTrack clones pre-existing in host tissues: 1 cell in 319,000 tumour T cells and 1 cell in 233,000 T cells from tumour-adjacent tissue (Fig. 2g, top). No vaccine-induced cells resided among 18,100 DLN or 817,000 blood T cells (Fig. 2g, top). Out of the 79 CloneTrack clones, we detected only 2.5% pre-treatment (Fig. 2g, bottom left) among a total pool of 736,000 clones (1.4 million T cells; Fig. 2a). By contrast, 73% of anti-PD-L1-expanded clones (16 out of 22 clones expanded in vaccine responders by CloneTrack; Extended Data Fig. 6a) existed pre-treatment in single or multiple host compartments, with variable clone sizes (Fig. 2g, bottom right and Fig. 2h). Similar to the CloneTrack clones, only 6 out of the 58 neoantigen-specific clones identified in vitro (neoantigen-specific plus neoantigen-mapped clones; Extended Data Fig. 3a–c) in 8 responders pre-existed in any host tissues (Extended Data Fig. 3d). Thus, in patients with PDAC, unlike anti-PD-L1, which amplifies pre-existing clones, autogene cevumeran primes multiple naive clones that are undetectable in pre-vaccination host tissues to high magnitudes de novo.As autogene cevumeran induced multiple T cell clones to persist long term in blood, to capture complete phenotypic histories of CloneTrack clones over time, we developed a computational strategy (PhenoTrack) that utilizes single-cell RNA and TCR sequencing to track the phenotypes of 9,110 single T cells of nearly all (68 out of 71) CloneTrack clones in the 6 responders who received both vaccine prime and boost doses and in whom clones persisted to approximately 3 years post-vaccination.First, we noted that across patients, CloneTrack clones were, as previously described1, primarily CD8+ T cells (Extended Data Fig. 7a), with transcriptional signatures that segregated according to post-vaccination times when clones expanded (expansion phase, during vaccine priming), contracted (contraction phase, the end of vaccine priming to initiation of mFOLFIRINOX), and would be expected to persist as memory T cells7 (memory phase, post-contraction; Fig. 3a, left). CloneTrack clones in the expansion phase overexpressed genes characteristic of proliferating cells (MKI67 and others by Gene Set Enrichment Analysis (Methods); proliferative state) relative to all other phases, whereas effector genes (GZMB, GZMH, NKG7, PRF1 and JUN family genes; effector state) were modulated in the contraction phase (Fig. 3a, right and Supplementary Table 1). By contrast, CloneTrack clones that persisted in the memory phase did not differentially overexpress conventional markers of central or effector memory T cells8 (including SELL, TCF1, IL7R, CCR7 and others; Extended Data Fig. 7b) but instead overexpressed effector genes (GZMB, GZMM, GZMH, GNLY, NKG7 and JUN family genes) and the core transcription factor of CD8+ tissue-resident memory T (TRM) cells (ZNF683 (also known as HOBIT); TRM-like state; Fig. 3a, right and Supplementary Table 1)9—long-lived T cells that reside in tissues and exhibit potent effector function upon antigen rechallenge9, but may also circulate10 and restrain cancer cells in dormancy in low antigen burden states11. These findings suggest that autogene cevumeran-primed T cells proliferate early, then contract, retain effector features and persist long term in a possible TRM-like state that is endowed with circulatory capability.a–e, Longitudinal phenotypes of 68 out of 71 CloneTrack clones in blood from 6 vaccine responders by single-cell RNA and TCR sequencing. a, Top left, uniform manifold approximation and projection (UMAP) plots of CloneTrack clone T cells by post-vaccination time and phase. Bottom left, schematic of CloneTrack clone phases in patient 1. a,b, Top 50 differentially expressed genes in CloneTrack clone T cells by phase relative to other phases (a, right) and by memory subphase relative to other subphases (b). Gene lists include genes that are characteristic of proliferative, effector and TRM cells overexpressed by phase or subphase (a full gene list is provided in Supplementary Table 1). c, Left, transcriptional clustering of CloneTrack clone T cells by phenotype from single-cell RNA-sequencing (scRNA-seq) data. Right, PhenoTrack plot of phenotype composition and conversion of 68 out of 71 CloneTrack clones over time in 6 responders. Vertical coloured bars show the proportion of cells of each phenotype at corresponding times. Individual PhenoTrack plots are shown in Extended Data Fig. 8b. d, UMAP (top) and phenotype composition (bottom) of CloneTrack clone T cells post-vaccination. e, Phenotype conversion of CloneTrack clones from expansion to contraction (top) and contraction to memory (bottom) in n = 6 primed and boosted responders with persistent clones. Phenotype is plotted as probability (prob.) of each phenotype for clones from each responder. Patient 25 had no persistent clones and was analysed individually in Fig. 5a. Patient 5 did not receive a boost. Arrow width indicates clone frequency aggregated across patients; proximity of arrow base to the axis indicates fraction of cells per patient in a phenotype; arrows point from phenotype origin to destination. n is the number of cells or clones.Source DataAs the memory phase spanned 2.5 years post-vaccination, we next subdivided the memory phase into early (0.8–1.8 years), mid (1.9–2.3 years) and late (beyond 2.4 years) memory phases (Fig. 3b and Supplementary Table 1) to further probe whether CloneTrack clones acquired TRM-like features over time. Aligned with a TRM-like phenotype with circulatory capability, relative to all other phases, CloneTrack clones not only overexpressed the core TRM transcription factor gene ZNF68312 selectively throughout all memory phases, but also progressively co-overexpressed the other two hallmark TRM transcription factor genes PRDM112 (also known as BLIMP1) and RUNX313 in later memory phases (Fig. 3b). Furthermore, CloneTrack clones in the memory phase also overexpressed the transcription factor gene KLF2, which promotes tissue egress8,14, CXCR4, which promotes tissue entry, TGFB1, which may promote TRM formation and persistence8,15 and T cell stemness8 (Fig. 3b), poorly expressed tissue retention receptors (Extended Data Fig. 7c) and progressively retained and overexpressed effector (GZMB, JUN family, ZEB2 and MALAT1)16,17,18 and other TRM-associated (IFITM3 and DUSP1)19,20 genes (Fig. 3a,b). CloneTrack clones in the memory phase did not express phenotypic markers on the T cell exhaustion continuum8,21 (Extended Data Fig. 7d). Collectively, these data strongly suggest that autogene cevumeran induces CD8+ T cells that persist long term in the circulation and do so in a stable non-exhausted TRM-like effector state.Next, as CloneTrack clones exhibited three distinct post-vaccination states (proliferative state during expansion, effector state during contraction and TRM-like state during memory phase; Fig. 3a), we sought to examine how individual clone phenotypes transitioned over time. We assigned single cells to phenotypes associated with proliferative, effector and TRM-like states (Fig. 3c, left, Extended Data Fig. 8a and Methods) and visualized clone phenotypic transitions using Sankey plots (Fig. 3c, right and Extended Data Fig. 8b), which differ from standard Sankey and alluvial plots by tracking phenotypes for clones as they expand and contract.In the expansion phase, 85% of CloneTrack clone cells assumed the proliferative state, 11% assumed the effector state and 3.5% were in the TRM-like state (Fig. 3d). Clones then rapidly contracted over 5 weeks and transitioned (Fig. 3c, right inset) from the proliferative state to primarily the effector (58% of vaccine-induced T cells) and the TRM-like (31% of vaccine-induced T cells) states in the contraction phase (Fig. 3d), with cells of individual CD8+ T cell clones assuming all phenotypes (Fig. 3e, top and Extended Data Fig. 8c, top). Entering the memory phase, clones remained in both cell states—although they were predominantly TRM-like—over the next 2.5 years, thus retaining effector features despite the patients receiving mFOLFIRINOX after prime and subsequent boost doses (Fig. 3c,d). As in the proliferative to contraction transition, single clones simultaneously persisted in both cell states from contraction into memory (Fig. 3e, bottom and Extended Data Fig. 8c, bottom). In sum, autogene cevumeran induces CD8+ T cell clones de novo that converge long term to TRM-like and effector T cells, which are potentially poised to respond to antigen rechallenge.To test whether the persistence of CloneTrack clones in responder blood correlated with preserved neoantigen-specific functional recall long term, we serially rechallenged peripheral blood mononuclear cells (PBMCs) isolated post-priming to approximately 3.6 years post-vaccination (approximately 3.8 years post-surgery) with ELISpot-positive vaccine neoantigens in vitro and examined CD8+ T cell cytokine production and lytic capacity (Fig. 4a). Overall, CD8+ T cells in all vaccine responders produced cytokines (IFNγ and TNFα) and degranulated on neoantigen rechallenge post-priming (Fig. 4a) and continued to produce effector cytokines and display lytic potential up to 3.6 years post-vaccination in 6 of 8 vaccine responders (Fig. 4a,b). Specifically, in 4 out of 4 monotope responders (Extended Data Fig. 9a) and 2 out of 4 polytope responders (Fig. 4a, bottom, c and Extended Data Fig. 9b), CD8+ T cells continued to produce IFNγ and TNFα and degranulated upon in vitro neoantigen rechallenge with previously determined1 ELISpot-positive dominant and subdominant vaccine neoantigens up to 3.6 years post-vaccination. Moreover, loss of neoantigen functional recall roughly correlated with clonal persistence, as both patients without recall exhibited polytopic responses with the lowest aggregate CloneTrack clone frequencies in the blood at late post-vaccination times (patients 10 and 25; Fig. 4c, right), suggesting that CloneTrack clones that persist can mediate effector function. To further characterize features of long-lived vaccine-induced clones, we mapped the avidity of 12 TCRs, including 10 CloneTrack clones and 2 vaccine neoantigen-specific clones identified in vitro (Extended Data Fig. 3b) that persisted long term (median lifespan 8.8 years) in 3 responders (Fig. 4d). TCRs of vaccine-induced clones displayed lower half-maximal effective concentration (EC50) and higher avidity to cognate neoepitopes compared with wild-type epitopes and included neoepitope–TCR pairs with nano- and subnanomolar avidity (Fig. 4d, bottom right), confirming that passenger mutations in PDAC—a tumour with low mutational burden—can generate high-avidity neoepitopes that are recognized by endogenous T cells. Furthermore, higher relative avidity of TCRs to the neoepitope compared with the wild-type epitope (higher log (C)) correlated with shorter clone half-life after prime but not after boost (Fig. 4d), suggesting that higher relative epitope strength may correlate with rate of clonal decay. Together, these results indicate that in patients with PDAC, autogene cevumeran induces CD8+ T cell clones, including clones with high avidity to PDAC neoepitopes, that persist up to 3.6 years post-vaccination, retain multiple effector function long term, and display the potential to persist for decades.a–c, Longitudinal cytokine production and lytic capacity of CD8+ T cells after in vitro rechallenge with immunodominant and subdominant (subdom.) ELISpot-positive vaccine neoantigens in responders. a, Top, post-rechallenge aggregate percentage of IFNγ+TNFα+CD8+ T cells (cytokine production) and CD107a+CD8+ T cells (lytic capacity) in responders. The y axis shows the ratio of neopeptide-activated T cell fraction to the DMSO-activated T cell fraction. Asterisk (*) indicates altered treatment sequence for patient 14. Bottom, representative flow cytometry of T cells from a vaccine responder. b, Longitudinal median percentage of CD8+ T cell subsets (top) and percentage of responders with polyfunctional (cytokine+CD107a+) vaccine neoantigen-specific CD8+ T cells (bottom) after in vitro neoantigen rechallenge. c, Left, aggregate fraction of CloneTrack clone T cells in blood and percentage of IFNγ+TNFα+CD8+ T cells after in vitro rechallenge in two responders with waning immunity. Right, aggregate percentage of CloneTrack clone T cells in blood stratified by responders with or without neoantigen-specific IFNγ+TNFα+CD8+ T cells more than one year post-vaccination by in vitro rechallenge. a–c, Dominant and subdominant neoantigens are vaccine neoantigens that were previously determined1 to elicit IFNγ+ T cells by ex vivo IFNγ ELISpot in PBMCs collected 1–3 weeks post vaccine priming (dominant neoantigens elicit a maximal T cell response; subdominant antigens elicit a non-maximal T cell response). DMSO was used as a control. d, Avidity (left) and EC50 values (right) for TCR-transduced CD8+ T cells cultured with human leukocyte antigen (HLA)-matched, neopeptide or wild-type (WT) peptide-pulsed antigen-presenting cells. TCRs isolated from CloneTrack or neoantigen-specific clones (asterisk) are identified as in Extended Data Fig. 3a–c. Residues shown in red are mutated amino acids. log(C) is the antigenic distance28. Flow cytometry is gated on live CD3+CD56−CD8+ cells (a) or live CD3+CD8+ TCR-transduced cells (d). n is the number of patients. P values by two-tailed Mann–Whitney test (c, right) and two-sided Wilcoxon matched-pairs signed rank test (d, bottom right). Error bars in d indicate s.e.m.Source DataAs two responders (patients 25 and 14) recurred during the observation period, we explored whether variations in vaccine immunity correlated with PDAC recurrence. Patient 25—a polytope responder, the first responder to recur, and the only responder to die (from locally recurrent PDAC)—had an approximately tenfold shorter observed T cell lifespan compared with other responders (Fig. 5a, left). All six CloneTrack clones steeply declined after the eight priming doses (Extended Data Fig. 2a). Notably, in this patient, the boost dose re-expanded but did not rescue primed CloneTrack clones, with subsequent disappearance of CloneTrack clones prior to death of the patient (Extended Data Fig. 2a). This shorter T cell longevity was not owing to distinct post-priming phenotypes (Fig. 5a, bottom). Similar to other responders (Fig. 3c,e and Extended Data Fig. 8b,c), CloneTrack clones from this patient were a mix of proliferative and effector phenotypes post-priming that converged to the TRM-like state. Patient 14—a monotope responder, and the second responder to recur (stable, solitary 1-cm lung metastasis)—had an altered treatment sequence, resulting in later onset of CloneTrack clones (34 weeks post-surgery) compared with the other 7 responders (median 13 weeks after surgery; Fig. 5a, middle), with clones similarly adopting effector and TRM-like states in the memory phase (Extended Data Fig. 8b). Thus, both individuals who recurred had weaker cumulative vaccine immunity (aggregate CloneTrack clone T cells integrated over the follow-up window; Fig. 5a, right) due to shortest longevity or latest onset.a, Top, estimated lifespan (left), observed time of onset (middle) and cumulative frequency (right) of vaccine-induced CloneTrack clone T cells over the observation period in responders with or without recurrence. Bottom, longitudinal phenotype of CloneTrack clone T cells in patient 25. b, Computed tomography (top; with tumour diameter in red) and histopathology (bottom left) of the solitary lung metastasis from patient 14. Bottom right, vaccine-induced T cell clones in blood and a recurrent tumour from patient 14. CloneTrack+, blood T cell clones identified by CloneTrack as in Extended Data Fig. 2a; CloneTrack− NA-specific, blood T cell clones identified as neoantigen-specific in vitro as in Extended Data Fig. 3a–c. c, Percentage (top) and phylogeny (bottom) of cancer clones in primary and recurrent tumours that harbour immunogenic and non-immunogenic vaccine neoantigens (as determined by ex vivo IFNγ ELISpot1) in patients 14 and 29. Prim, primary tumour; Recur, recurrent tumour. Red and blue indicate increasing and decreasing cancer clone fraction (CCF) from primary to recurrent tumours, respectively. Green circles indicate clones with immunogenic vaccine neoantigens. n is the number of patients, cells or clones. P values by two-tailed Mann–Whitney test (a, right), two-tailed Wilcoxon matched-pairs signed rank test (b, bottom) and two-tailed paired t-test (c, top).Source DataTo examine whether CloneTrack clones retained function to infiltrate recurrent tumours, we searched for CloneTrack clones in the solitary lung metastasis of patient 14 (Fig. 5b, top). Seven out of the eight CloneTrack clones that persisted in the late memory phase were clonally expanded in the recurrent tumour compared with blood (Fig. 5b, bottom). Additionally, three neoantigen-specific clones identified in vitro but not by CloneTrack (Extended Data Fig. 3b) were also present in the recurrent tumour (Fig. 5b), suggesting that both CloneTrack and in vitro-identified neoantigen-specific clones retained in vivo function to infiltrate distant tumours. To further examine whether these T cell clones were exerting selective pressure on clinically undetectable tumour clones, we tested whether vaccine-induced immunity could exert selective pressure on tumour clones carrying immunogenic vaccine neoantigens, either directly through selective loss of vaccine-targeted tumour clones, or indirectly through acquired immunity against neoantigens that were not included in the vaccine. We did not detect clear evidence of acquired immune activity (which would suggest neoepitope spread) against tumour mutational neoantigens that were not included in vaccines in any responder (Extended Data Fig. 10). However, using whole-exome sequencing and phylogenetic analyses, we examined how primary PDACs longitudinally evolved to recurrence in patient 14 and patient 29—a patient who was previously reported1 to develop a disappearing solitary liver micrometastasis (criteria for clinical recurrence not met) infiltrated by vaccine-induced T cell clones. Consistent with vaccine-induced immunity exerting selective pressure on micrometastatic tumour clones, recurrent tumours from both patients evolved with fewer tumour clones carrying immunogenic vaccine neoantigens (Fig. 5c).Can we overcome host tolerance to generate strong, specific, functional and durable T cells against a tumour antigen? If so, which antigens, vaccines and hosts can collectively generate such a response? Here in PDAC, one of the most lethal and oncologically challenging cancers, which kills 88% of patients22, we show that autogene cevumeran, an unmodified uridine-based mRNA–lipoplex vaccine that targets somatic mutation-derived neoantigens, administered in patients with minimal disease burden, may offer a composite solution to this challenge.The substantial longevity and functionality of vaccine-induced CD8+ T cell clones identified by CloneTrack following fixed prime-boost vaccination is notable. Vaccine-induced CloneTrack clones exhibit estimated multiyear lifespans, with nearly a quarter of clones estimated to have multi-decade lifespans, longer than conservatively estimated patient lifespans. Notably, these cells exhibit robust neoantigen-specific T cell polyfunctionality for up to 3.6 years post-vaccination. Furthermore, vaccine-induced clones can infiltrate recurrent PDACs, as observed previously in one patient1 and in a second in this study. Although one patient (patient 1) contributed a large number of clones to the pool of vaccine-induced clones, subset analysis in individual patients reveals substantial estimated longevity of clones in all individual boosted patients. These lifespan estimates will require additional experimental validation in future work. Nevertheless, they indicate that it is possible to generate long-lived, functional CD8+ T cells that are specific for a tumour antigen without repetitive boosting in diseased hosts. Our vaccination strategy and the mRNA vaccine platform appear to surpass several vaccine litmus tests—the magnitude of vaccine-induced CD8+ T cells that persist over time in steady state appears comparable, if not higher, than that of vaccine-induced CD8+ T cells observed with highly successful pathogen vaccines23, where even single immunizations confer lifetime immunity24. Furthermore, vaccine-induced long-term immunity consists predominantly of CD8+ T cells, mimicking possible ‘natural’ immunologic control in PDAC25. However, we cannot rule out that vaccines also induce CD4+ T cells. Crucially, vaccine-induced immunity spans the PDAC recurrence window, thus potentially conferring protection throughout the period of highest susceptibility, a desired feature for a cancer vaccine. Although we demonstrate that unmodified mRNA lipoplexes that target neoantigens in minimally diseased hosts trigger lasting immunity, it remains to be seen whether vaccines that target other antigen classes or utilize emerging vaccine platforms can achieve similar durable functionality.We cannot exclude that vaccine-induced T cell clones may be present in tumour or lymph node regions that were not sampled in this study. However, it is notable that despite the relatively low mutational burden of PDAC and thus its presumed lower neoantigen content, autogene cevumeran, a uridine-based mRNA neoantigen vaccine, primes long-lived T cells de novo against passenger mutations rather than amplifying pre-existing CD8+ T cells. Given that such neoantigens are fundamental byproducts of oncogenesis, and adjuvant therapy in minimally diseased hosts is a ubiquitous cancer treatment paradigm, our findings expand the theoretical vaccine-eligible pool to nearly all cancers, and not only those that elicit a robust endogenous neoantigen-specific T cell response. Immunologically cold tumours with few mutations, such as gastrointestinal cancers, appear to be ideal initial disease indications, given the often relatively low mutational burden, insensitivity to immune checkpoint inhibitors, continued reliance on last-generation cytotoxic chemotherapy as standard treatment and poor prognosis.Although we find that lower cumulative vaccine immunity correlates with early recurrence in responders, the significance of this observation is limited by the small sample size. Nevertheless, the observation further supports the hypothesis that adjuvant autogene cevumeran may delay PDAC recurrence. Indeed, we report durable correlations between vaccine response and RFS at 3.2-year follow-up with a similar effect size to that observed at an earlier 1.5-year follow-up1. Although we did not previously detect1 (and currently selectively confirm) differences in responder and non-responder treatment, tumour or host immune fitness, unknown factors may confound the correlation between vaccine response and RFS. Nevertheless, utilizing complete clonal histories of more than 9,000 single cells in 6 patients, we show that most vaccine-induced CD8+ T cell clones transition into the memory phase as stable effector T cells, and provide comprehensive characterization of the longitudinal state transitions and long-term phenotypes of mRNA cancer vaccine-induced T cells. Notably, the vaccine-induced T cells that persist into the memory phase do not acquire exhaustion features despite multiple priming doses26, and may phenotypically resemble human TRM cells with circulatory function described in mice10. Of note, loss of vaccine-induced neoantigen-specific functionality is not associated with longitudinal T cell phenotypic change but appears linked to loss of the neoantigen-specific T cells themselves. Although it remains unknown whether vaccine-induced T cells retain this effector function within tumours, this observation opens the possibility to maintain or rescue immunity with real-time monitoring and scheduled or on-demand boosting. Although speculative, a vaccine T cell ‘titre’ to dynamically monitor and boost T cells—as we show is feasible with CloneTrack—can empower such advances and warrants future investigation.That the mutational profile of recurrent PDACs evolved under vaccine-induced selective pressure is both predictable and notable. Although we did not observe this clonal pruning together with T cell immunity spreading to non-vaccinated mutational neoantigens, this finding suggests that vaccine-induced T cells target subclinical cancer clones, and consequently, one mechanism of vaccine resistance may be clonal escape. Notably, a lack of observed neoantigen spread does not rule out immunity spreading to other mutational or non-mutational antigens, as the neoantigens tested in our study may be non-immunogenic. Indeed, neoantigen spread may be more prominently observed in settings of higher neoantigen burden27, such as in more highly mutated cancers that elicit stronger endogenous immunity and may not be an observed feature in a tumour with fewer mutations. Nonetheless, effective cancer vaccines may require initial polyvalent vaccines that target all heterogeneous cancer clones, with subsequent neoantigen resampling and adaptive vaccination to target clonal escapes or, alternatively, vaccines that induce T cells against clonal neoantigens with high potency and durability.In sum, we present additional evidence with longer follow-up that autogene cevumeran—a uridine-based mRNA vaccine against somatic mutation-derived neoantigens—can generate strong, specific, functional and durable CD8+ T cell immunity in PDAC that correlates with delayed recurrence. A global randomized trial (IMCODE 003; NCT05968326) is ongoing. As mutation-derived neoantigens are fundamental features of transformed cells, our findings provide support for broad testing of mRNA neoantigen vaccines as adjuvant cancer therapies.In our previously reported1 single-centre, investigator-initiated, phase 1 clinical trial, patients with single, radiographically suspicious, surgically resectable PDAC, no distant metastases, and ≥5 neoantigens as predicted by our computational pipeline were treated with sequential surgery, adjuvant atezolizumab (anti-PD-L1), autogene cevumeran (an individualized vaccine based on uridine mRNA–lipoplex nanoparticles encoding up to 20 MHCI and MHCII restricted neoantigens) and mFOLFIRINOX. All patients had ECOG (Eastern Cooperative Oncology Group) performance status 0–1. We included patients with pathologically confirmed PDAC with surgical margin status R0/R1. We excluded patients with metastatic, borderline or locally unresectable PDAC and patients who received neoadjuvant therapy. The primary endpoint was safety. Secondary endpoints were 18-month RFS and 18-month OS. Additional eligibility criteria, procedures, treatments, and ethical study conduct have been described and are available in the protocol1 (Supplementary File 1).We treated 19 patients with atezolizumab (safety-evaluable cohort), of which 16 patients received subsequent autogene cevumeran (biomarker-evaluable cohort)1. Fifteen of these 16 patients received subsequent mFOLFIRINOX. As described previously1, vaccinated patients were classified as autogene cevumeran (vaccine) responders if they generated high-magnitude T cell responses to vaccine neoantigens assessed by a previously described ex vivo IFNγ ELISpot assay29 that detects vaccine-induced T cell responses and does not distinguish CD8+ from CD4+ T cell responses.We defined recurrence as new lesions by response evaluation criteria in solid tumours (RECIST, version 1.1). We defined RFS from either the date of surgery (RFS) or from the date of the last autogene cevumeran priming dose (landmark RFS) to the date of recurrence or death, whichever occurred first. We defined OS from the date of surgery to the date of death. We censored patients without events at the last known date they were recurrence-free. We defined the recurrence window as the time frame from surgery when ~80% of patients recur2,3,4. Data cut-off was 1 December 2023, extending the median follow-up to 38 months.We conducted the study in accordance with the Declaration of Helsinki and good clinical practice guidelines. The study was approved by the institutional review board (IRB) at Memorial Sloan Kettering Cancer Center (MSK), the United States Federal Drug Administration (FDA), and was registered on clinicaltrials.gov (NCT04161755). All participants provided written informed consent.We previously reported detailed characteristics of vaccine neoantigen selection1. In brief, we identified expressed non-synonymous mutations and HLA type by whole-exome sequencing of patient-specific tumour–normal pairs and tumour RNA sequencing. We then bioinformatically estimated neoantigens and ranked neoantigens by immunogenicity as previously described30.As reported1, for every patient, we manufactured individualized mRNA neoantigen vaccines under good manufacturing practice conditions as two uridine-based mRNA strands with noncoding sequences optimized for superior translational performance31,32. We designed each strand to encode up to 10 MHCI and MHCII neoantigens formulated in approximately 400-nm diameter lipoplex nanoparticles26 that comprised the synthetic cationic lipid (R)-N,N,N-trimethyl-2,3-dioleyloxy-1-propanaminiumchloride (DOTMA) and the phospholipid 1,2-dioleoyl-sn-glycero-3-phosphatidylethanolamine (DOPE) to enable intravenous delivery.We purified patient PBMCs by density centrifugation over Ficoll-Paque Plus (GE Healthcare) and cultured purified cells in RPMI medium supplemented with 10% fetal bovine serum (FBS, Nucleus Biologics), 1 mM sodium pyruvate, 2 mM l-glutamine, non-essential amino acids and 2-mercaptoethanol, 100 U ml−1 penicillin-streptomycin (MSK medium preparation core facility), with 100 U ml−1 IL−2 (Peprotech) and 100 U ml−1 IL-15 (Peprotech) added every other day. To map single clone reactivity, we purchased pan negative selection purified human T cells (Precision for Medicine) and cultured purified T cells in RPMI medium (Gibco, Thermo Fischer Scientific) supplemented with 10% FBS (Sigma-Aldrich), 100 U ml−1 penicillin-streptomycin (Gibco, Thermo Fischer Scientific), 1,000 U ml−1 IL-7 (Peprotech, Thermo Fischer Scientific), 100 U ml−1 IL-15 (Peprotech, Thermo Fischer Scientific) and 4 mM l-glutamine (Gibco, Thermo Fischer Scientific). We cultured T2 and K562 cells with RPMI medium (Gibco, Thermo Fischer Scientific) supplemented with 10% FBS (Sigma-Aldrich) and 100 U ml−1 penicillin-streptomycin (Gibco, Thermo Fischer Scientific). We cultured Phoenix-AMPHO and RD114-envelope producer cells with DMEM medium (Gibco, Thermo Fischer Scientific) supplemented with 10% FBS (Sigma-Aldrich) and 100 U ml−1 penicillin-streptomycin (Gibco, Thermo Fischer Scientific). We froze tumour, adjacent tissue and draining lymphatic tissue samples from resected tumour specimens for subsequent analysis.We cloned patient-matched HLA alleles and transduced T2 and K562 cells as previously described1. In brief, we cloned HLA alleles followed by an IRES GFP reporter into a SFG γ-retroviral vector and transfected Phoenix-AMPHO cells using Lipofectamine 3000 (Thermo Fisher Scientific). We collected vector-containing supernatants and used them to transduce T2 and K562 cells by spinoculation in the presence of Polybrene (EMD Millipore). We sorted HLA+ K562 cells and GFP+ T2 cells using an Aria Cell sorter (BD Biosciences).We reconstructed and cloned TCRs as previously described1. In brief, we identified T receptor beta (TRB) V-D-J and T receptor alpha (TRA) V-J sequences from purified, sequenced single T cells and fused them to modified mouse constant TRB and TRA chain sequences, respectively. Then, we joined TRB and TRA chains with a furin SGSG P2A linker and cloned them into a SFG γ-retroviral vector. We transduced human pan T cells as previously described1 with minor modifications. In brief, we transfected Phoenix-AMPHO cells with SFG γ-retroviral vectors using Lipofectamine 3000 (Thermo Fisher Scientific). Then, we used vector-containing supernatants to transduce RD114-envelope producer cells. We sorted transduced cells to generate stable cell lines and concentrated vector-containing supernatants using Retro-X Concentrator (Takara). We activated human pan T cells with CD3/CD28 beads (Thermo Fisher) and transduced them at day 3 post-activation in a Retronectin (Takara) coated plate using concentrated vector-containing supernatants. Transduction efficiency was confirmed by flow cytometry gating on live CD8+ mTCR+ cells.To select possible neoantigen epitopes to test TCR specificity and binding, we generated all possible unique 8–14mers out of all full-length (18–27mer) immunogenic (ELISpot-positive) vaccine neoantigens. We predicted binding of each of these 8 to 14mers to the patient’s HLA-I by NetMHCPan4.1. We further selected peptides with binding affinities <1000 nM or predicted strong binders (as per NetMHCPan4.1) for further testing and peptide stimulation.We stimulated TCR-transduced T cells with peptides as follows: we pulsed 2.5 × 10⁵ HLA-transduced T2 or K562 cells in a 96-well U-bottom plate at 37 °C with the indicated peptides at the indicated concentrations for 1 h. Then, we centrifuged and washed the peptide, added 5 × 10⁴ TCR (effector:target ratio of 1:5) or mock (control) transduced T cells per well, and measured CD137 (4-1BB) expression on CD8+ mouse TCR+ T cells after 24 h in coculture. To calculate the avidity of a TCR for its cognate epitope and the corresponding wild-type peptide, we stimulated TCR-transduced T cells with antigen-presenting cells pulsed with different concentrations of mutant or wild-type peptide (range from 100 μM to 10−5 μM), performed a nonlinear regression to fit the data to a sigmoidal curve, and calculated the EC50 as the peptide concentration that activates 50% of the TCR-transduced T cells. When a TCR did not show reactivity with an EC50 value tending towards infinite, we assigned the EC50 to be 1,000 μM.We extracted gDNA from bulk PBMCs, purified T cells and patient tissue samples using a DNA extraction kit (Qiagen). We used Dropsense 96 to quantify samples, dilute standard concentrations, and prepare libraries. We then generated sample data using an immunoSEQ Assay (Adaptive Biotechnologies), as previously described1. In brief, we amplified the somatically rearranged TCRB CDR3 using a two-step, amplification bias-controlled multiplex PCR reaction, that contains forward and reverse amplification primers specific to every known V and J gene segment and amplifies the CDR3 receptor hypervariable locus, followed by a second PCR to add barcode and Illumina adapter sequences33. Reference gene primers in the PCR further quantify total nucleated cells available for sequencing, and thus measure the fraction of T cells in each sequenced sample. The CDR3 and reference gene libraries were then sequenced, raw sequence reads demultiplexed per Adaptive’s barcode sequences, and demultiplexed reads processed to remove adapter and primer sequences and identify and remove primer dimer, germline and contaminant sequences. Relative frequency ratios between similar clones and a modified nearest-neighbour algorithm were used to cluster the filtered results, and merge closely related sequences to correct for sequencing induced technical errors. The output sequences were then annotated to the V, D, and J genes and N1 and N2 regions that constitute each unique CDR3, and the corresponding encoded CDR3 amino acid sequence. We defined annotated genes per the IMGT database (https://www.imgt.org). The output TCR V CDR3 sequences were then normalized and corrected for residual multiplex PCR amplification bias and quantified versus synthetic TCRB CDR3 sequence analogues34.As reported1, we prepared libraries for single-cell immune profiling, sequenced and post-processed raw data at the Epigenomics Core at Weill Cornell Medicine.To analyse the gene expression of vaccine-induced clones, bulk T cells from patient-derived PBMCs were purified by fluorescence-activated cell sorting and sequenced as previously reported1. In brief, we purified single T cells and prepared scRNA-seq libraries as per company specifications prior to performing single-cell immune profiling (10x Genomics, guide CG000330). Each cellular suspension at 97% viability and at 950 cells per μl was loaded onto to a Chromium X to generate Gel Beads-in-Emulsion (GEM) targeting 10,000 single cells per sample.To generate 5 P expression libraries, we enzymatically fragmented an aliquot of the cDNA (~50 ng), and end-repaired, A-tailed, subjected to a double-sided size selection with SPRI select beads (Beckman Coulter), and ligated to adaptors. We then introduced a unique sample index for each library through 14 cycles of PCR amplification using the indexes (98 °C for 45 s; 98 °C for 20 s, 54 °C for 30 s and 72 °C for 20 s × 14 cycles; 72 °C for 1 min; held at 4 °C), subjected indexes to a second double-sided size selection, and quantified libraries using Qubit fluorometric quantification (Thermo Fisher Scientific). We assessed quality on an Agilent Bioanalyzer 2100, obtaining an average library size of 460 bp. To generate full-length TCR VDJ regions, we subjected cDNA aliquots (5 ng) to nested PCR amplification with specific VDJ outer and inner primer pairs (98 °C for 45 s; 98 °C for 20 s, 67 °C for 30 s and 72 °C for 20 s × 8 cycles; 72 °C for 1 min; held at 4 °C), 1-sided size selection using SPRI select beads, and assessed quality and quantity of the VDJ region using an Agilent Bioanalyzer 2100. The average library size was 620 bp.We then clustered gene expression and TCR libraries on an Illumina Novaseq pair end flow cell sequenced for 28-10-10-91, to obtain about 350 million clusters per sample. We processed sequencing images using Illumina’s Real Time Analysis software (RTA). We used 10x Genomics Cell Ranger Single Cell Software suite v6.0.0 (https://support.10xgenomics.com/single-cell-gene-expression/software/pipelines/latest/what-is-cell-ranger) to demultiplex, align (hg19), filter, UMI count, and single-cell 5′ end gene count samples, assemble TCRs, annotate paired VDJ, and perform quality control per manufacturer’s parameters.We defined a T cell clone by the nucleotide CDR3 sequence of the β chain and its V and J genes (TRB). For T cells identified by single-cell sequencing, we defined clones by the CDR3B nucleotide sequence, and mapped clones to paired TCR Vβ sequencing. The V/J genes were disregarded to remove cross-platform biases in V/J gene calling.We defined the frequency of a clone x as \({f}_{x}\,=\frac{{n}_{x}}{N}\), where nx is the number of reads corresponding to the clone x as defined above, and N is the summation of all productive (in-frame, no stop codons) reads, as done previously1.We computed the aggregate frequency of several clones \(x\in X\) using an aggregate count \({n}_{X}={\sum }_{x\in X}{n}_{x}\) and used a pseudo-frequency as previously described1 if \({n}_{X}=0\).We defined vaccine-induced and atezolizumab (anti-PD-L1)-induced clones as previously described1. In brief, in CloneTrack, we select a baseline timepoint, and a time period of interest, and compute P values for each clone to determine if it expands twofold or greater within the determined time period, using a modified Fisher exact test as previously described1, with Bonferroni multiple hypothesis testing adjustment for both the clones and the number of timepoints examined. We select the most significant timepoint for each clone with an adjusted P < 0.001. For vaccine-induced CloneTrack clones, we use the timepoint immediately preceding the vaccine priming dose as the baseline and define the expansion time period to extend until the first dose of chemotherapy (after completing all priming doses). We impose a de novo constraint on prime clones, such that the clones must not be detected in blood before the start of the priming doses. For anti-PD-L1-expanded clones, we use the timepoint immediately preceding the anti-PD-L1 dose as the baseline and define the expansion time period to extend until period immediately after anti-PD-L1. Our updated analyses yield identical clones as detected previously1.We defined a clone induced by a vaccine boost by modifying the above described modified Fisher exact test1 with a twofold expansion factor between the timepoints immediately pre- and post-boost, together with a de novo constraint and a significance threshold of adjusted P < 0.001 after accounting for the Bonferroni multiple hypothesis correction. No induced vaccine boost clones were found.As we have sufficient timepoints in our CloneTrack time series, we can utilize a standard mathematical method to estimate half-life and lifespan in biological and physical systems—fitting an exponential function to experimentally observed decay rates of individual T cell clones. For each clone, we plot the experimentally measured trajectory (Extended Data Fig. 4e, top), and then derive the half-life and lifespan for the clone after priming doses alone and after priming + boost doses as described below.To estimate the clone half-life and lifespan post-priming, we identify the peak priming time (time when the clone’s frequency peaks before boost), and select all times from peak priming to boost (Extended Data Fig. 4e, top, orange circles).To estimate the clone half-life and lifespan post-prime/boost, we identify the peak boost time (time of the clone’s first measured frequency post-boost), and select all times post peak boost.When a clone is not detected (frequency = 0), we impute its frequency \({f}_{{\rm{imputed}}}=0.5/\max \_{\rm{sample}}\_{\rm{norm}}\) where \(\max \_{\rm{sample}}\_{\rm{norm}}\) is the total sequence count in the largest sequencing sample in the time series.We then hypothesize that the frequency of a clone exponentially decays as a function of time:where f(t) = clone frequency at time t; f0 = peak clone frequency; τ = mean lifetime. There are two free parameters, \(f(t)\) and \({t}_{1/2}\), which must be inferred. To infer the free parameters for each of these curves, we performed a linear fit on the log of the clone frequencies using a least-square regression (implemented using stats.linregress).We take \({t}_{0}=0\) by subtracting peak time from all subsequent times, and linearize the exponential equation:We can now fit a linear regression to the above equation to derive the decay constant, \(\tau \). The fitted slope is \(m=-\,\frac{1}{\tau }\). Therefore:As the half-life of a clone is the time for a clone to reduce from its peak frequency by 50%,Where m is the fitted slope from the observed trajectory.We define lifespan as time for a clone’s frequency to fall below the detection threshold (10−6). We derive the lifespan (tdisappearance) as:The two quantities we report from these fits are the half-life (\({t}_{1/2}\)), and the lifespan (tdisappearance). These estimated values were then clipped at maximum values of 5 years for the half-life \({t}_{1/2}\), and 100 years for the disappearance time \(\Delta {t}_{d}\), including for any clones which were growing instead of shrinking, which would infer negative half-lives and lifespan.To estimate goodness of fit, we calculate the root mean square error (RMSE) that measures for each clone, how far each estimated point is from the observed frequency at that timepoint, averaged across the time series.Specifically, the RMSE is calculated asWhere N is the number of points being fitted, \({y}_{i}^{{\prime} }\) is the estimated frequency at timepoint i and yi is the observed frequency at timepoint i.We calculate the RMSE in the natural log space in which the equation is fitted and visualize the RMSE (Extended Data Fig. 4e, bottom) on a log10 scale, equivalent to the scale we plot the clone trajectories (Fig. 2b and Extended Data Fig. 2a). All estimated frequencies are within a factor of 10 of the observed frequencies, and 98 of 144 (68%) of estimated frequencies fits lie within a factor of 2 of the observed values.The survival curves of CloneTrack clones were determined based on time from first observation of the clone. As all of these clones were unobserved in the blood pre-vaccination, this appearance time (ta) can be determined precisely. For the observed survival time (\({t}_{s}\)), we took the difference from the last timepoint a clone is observed to the appearance time. For the estimated survival curves we determined the survival time using the disappearance time \(\Delta {t}_{d}\) and the start time \({t}_{0}\) (either peak prime frequency or post-boost follow-up time) for that fit:Note, patient 5 did not receive a boost, so their two CloneTrack clones are included in both the prime and total estimated survival curves.To measure the cumulative frequency of the CloneTrack clones up to a set point in time we computed an integrated average of the aggregate CloneTrack frequency time series. As T cell clone frequencies change on a logarithmic scale, we integrated and averaged the log of the frequency trajectory and then exponentiated at the end (a weighted geometric mean);Where \({p}_{c}(t)\) is the frequency trajectory of CloneTrack clone c. To avoid taking logs of zeros we used a minimum frequency of 2 × 10⁻⁶ if no CloneTrack clones were measured at a timepoint. We used a time t = 644 days for analysis, corresponding to the latest follow-up timepoint at which complete clonal analysis is available for all patients. The numerical integration was done using scipy.integrate.cumtrapz.To find additional T cell clones that may be responding to the vaccine, we looked for clonotypes with TCR sequences similar to the vaccine-reactive clones (that is, CloneTrack clones). We used GLIPH2.035 with default parameters to cluster all beta chain TCRs (including CDR3 amino acid sequence, V and J gene) of each patient using most available TCR sequencing samples for that patient (restricting samples to early follow-ups). Among the GLIPH groups that were labelled as significant (Fisher score <0.05) compared with the background CD4/CD8 reference TCRs provided by GLIPH2, we identified those containing CloneTrack clones (vaccine-responding metaclones). For each patient, TCR clones (defined by their nucleotide sequence and V/J genes) with CDR3 amino acid sequences belonging to each vaccine-responding metaclone were identified at each timepoint and the sum of the frequencies of these clones (excluding the original CloneTrack clones) was plotted for all available timepoints.Filtered count matrices generated by Cellranger (v6) were integrated into a single matrix using Scanpy36. Cells were filtered by having a sequenced high confidence TRB CDR3 region called from Cellranger VDJ (v6). Genes were further filtered based on whether the distribution of the gene expression over the set of cells that express the gene (non-zero expression) has at least 1 nat of entropy and the gene was found in at least 1% of total cells. Both mitochondrial and ribosomal genes were removed.Phenotyping was done using the GeneVector pipeline37. Cells and genes that pass quality control are embedded according to the GeneVector methodology using mutual information signed by the correlation coefficient into a 20-dimensional latent space38. Phenotyping was then done on cells belonging to CloneTrack clones (as identified by their TRB sequences) by fitting a gaussian mixture model with three components to the cosine similarity of each cell embedding vector onto five genes embedding six vectors (MKI67, GZMB, ZNF683 and KLF2) as implemented in Scikit-Learn39.We generated PhenoTrack plots using the phenotyping method described above. Each PhenoTrack plot is defined by examining a set, C, of T cell clones for a particular individual, and tracks the relative frequency, and flow of phenotypes of each clone. As clones can expand or disappear in the repertoire, these plots differ from standard Sankey and alluvial plots in that there is no balanced flow in and out of nodes. To define these plots, we first calculated the frequency of each phenotype fi for each clone c at each timepoint T, \({p}_{c,T}(\,{f}_{i}\,))\). This can be represented as a sum over all cells x that have clonotype c (indicated as \(x \sim c\)):Where XT is the set of sequenced clones at timepoint T, NT is the total number of cells in XT, and \(p(\,{f}_{i}\,|x)\) is the probability cell x has phenotype fi (if using deterministic assignments this is either 0 or 1). The static phenotype breakdown of each sequenced timepoint can be easily determined by summing over all clones in C:This is represented by the solid bars at the sequenced points. We can never determine phenotype swapping of individual cells, as any cell that was sequenced is necessarily not present at the next timepoint, so to determine phenotype flow from one point to the next we examined the phenotype probabilities of clones. It is also important to note that as a clone c may not have the same frequency at timepoint T as at timepoint T + t, the total flow out from a timepoint may not equal the flow into the next timepoint. This necessitated us to define both outflow and inflow between adjacent timepoints. The phenotype flow out from a phenotype fi to fj for an individual clone c between timepoints T and T + t can be defined according to an independent approximation:The inflow for this same transition only differs in the clone frequency normalization:To get the total flows over our clone set C we need only sum over the clones \(c\in C\):andThese outflows and inflows, along with a simple Hill function interpolation between the two, determine the width of the bands showing the transitions between phenotypes. Each band is coloured based on the phenotype it flows out of. Also note, that because a clone may not be present at both timepoints the total flow in/out of a timepoint may not equal the static probabilities, that is:andindicating clones either leaving or entering the repertoire at those respective timepoints. For PhenoTrack plots that aggregate over individuals, all of these equations were averaged over the individuals.We define pre/post-vaccination phases as follows:Expansion: all time periods during priming doses of autogene cevumeranContraction: all time periods after priming doses of autogene cevumeran and before mFOLFIRINOXEarly memory: 0.8–1.8 years post-vaccinationMid memory phase: 1.9–2.3 years post-vaccinationLate memory phase: all time periods from 2.4 years onwardsThe ternary plots were generated by reducing the phenotype space to three phenotypes and determining the phenotype breakdown of each clone of interest only with respect to these phenotypes:These 3D probability vectors can then be plotted on the 2D simplex. Single timepoints can be represented as a scatter plot and transitions between timepoints can be represented by arrows. The width or size of a marker represents the frequency of the clone at the initial timepoint. Clones can also be aggregated together by summing and renormalizing.The probability of each amino acid CDR3 TRB to be generated through VDJ recombination, also known as Pgen, was computed using the OLGA software40. Pgen was computed for each TRB in all baseline samples for responding patients using the default human TRB IGoR model41 shipped with OLGA. Each Pgen was computed for the amino acid CDR3 TRB excluding V and J gene restrictions.For the differential gene analysis, we specifically examined only cells belonging to CloneTrack clones in patients 1, 6, 10, 11, 14 and 29 (n = 9,110 cells). We normalized the gene expression by the total number of counts in each cell (implemented by scanpy.normalize_total) and computed log gene expression on the normalized genes expression (implemented by scanpy.logp1):where GE(c,g) is the read count of gene g in cell c.We computed the differential gene heatmap between phases phase-by-phase. Only genes that were not ribosomal or mitochondrial were considered (n = 24,800). For each phase, we identified genes that were the most significantly upregulated in cells from that phase relative to all other (CloneTrack) cells using Mann–Whitney U with Bonferroni multiple hypothesis correction with an adjusted P value threshold of 0.001. Genes that passed significance were then ordered by their mean differential log2 gene expression:where Ph indicates the cells from a particular phase. We depict the top 25 upregulated genes from the phases: expansion, contraction, memory as a heatmap composed of the differential expression for each of these genes at each of the above phases (Fig. 3d).We generated the gene expression violin plot for a gene g by using the LGE(c,g) of that gene for cells of the labelled phases.We perform gene set enrichment analysis to confirm genes expressed by vaccine-induced T cells in the expansion phase are modulated by proliferating T cells42 (gene set: Travaglini_Lung_Proliferating_NK_T_Cell, P value = 2.3 × 10⁻²², false discovery rate q value = 3.7 × 10⁻¹⁹), and in the contraction phase modulated by CD8+ T cells post-antigen exposure (gene set: Kaech_Day8_Eff_VS_Memory_CD8_TCell_DN, P value = 7.8 × 10⁻¹⁸, false discovery rate q value = 5.4 × 10⁻¹⁵).We applied the same bioinformatic pipeline as previously described28. In brief, we aligned reads to the reference human genome (hg19) using BWA (v0.7.17)43, and marked duplicates by picard-2.11.0 MarkDuplicates (https://broadinstitute.github.io/picard/). Then, we performed indel realignment by the Genome Analysis toolkit (GenomeAnalysisTK-3.8-1)44 using RealignerTargetCreator and IndelRealigner. We used the 1000 genome phase1 indel (1000G_phase1.indels.b37.vcf) and Mills indel calls (Mills_and_1000G_gold_standard.indels.b37.vcf) as references. We then calibrated base quality by the GATK’s BaseRecalibrator using dbSNP version 138 as reference source. After a pre-processing step, we employed MuTect 1.1.745 and Strelka 1.0.1546 to identify SNVs and indels in tumour samples compared to normal tissue. Using bam-readcounts (v0.8) (https://github.com/genome/bam-readcount), we counted the number of reference and alternative alleles at each mutation position. We then filtered mutations by coverage and variant allele frequency (VAF) by the following criteria: (1) total coverage for tumour ≥10; (2) VAF for tumour ≥4%; (3) number of reads with alternative allele ≥9 for tumour; (4) total coverage for normal ≥7; and (5) VAF for normal ≤1%. After filtering, we took union of filtered mutations within each individual, leveraging primary and recurrent samples. This allowed us to capture coverage and VAF changes from primary to recurrent tumours, even for undetected mutations. We repeated the bam-readcount step for this union set of mutations. Since VAF is not a normalized measure to represent cancer cell fraction (CCF), we used phyloWGS (v1.0-rc2)47 to reconstruct the phylogeny tree and also to infer CCF on the merged set of mutations. Primary and recurrent tumours share the same topology, but the CCF can differ between primary and recurrent samples. We chose the tree for each sample that has the largest likelihood value. We visualized trees with R package data.tree (v1.1.0) (https://cran.r-project.org/web/packages/data.tree/index.html). The colour represents CCF changes from primary to recurrent tumours in log scale (log CCFrec/CCFprim).For each neoantigen, we designed 2–4 overlapping 15mer peptides (OLPs, Genscript) covering the mutated neoantigen sequence encoded by the RNA vaccine (Genscript). We resuspended all peptides in DMSO at 10 mg ml−1. Then, we cultured 1 × 10⁶ PBMCs in a 48-well plate with peptide pools (total peptide concentration of 20 μg ml−1) added on day 1, and IL-2 (100 U ml−1) and IL-15 (10 ng ml−1) added on day 2 and every subsequent 2–3 days. Then, on day 7 we restimulated PBMCs with peptide pools, and analysed T cell degranulation by incubating stimulated cells for 1 h with an anti-CD107a antibody, and T cell TNFα and IFNγ production by incubating stimulated cells for 4 h at 37 °C with a protein transport inhibitor (BD Biosciences) and measuring intracellular cytokine production by flow cytometry.To detect epitope spreading in responders, we stimulated PBMCs in vitro with neoantigens not encoded in vaccines. First, we used WES to identify somatic mutations as described above. Then, we filtered out mutations either included in the vaccine, called with low confidence, or whose transcript encoded an amino acid sequence present in the patient reference proteome (that is, we excluded synonymous, stop gain, and start loss mutations). From this set, we computationally created 27mers with the mutated residue at position 14 (where fewer than 13 amino acids were available before or after the mutated residue, all available residues were included), tested binding of 27mer derived 8 to 14mer neoepitopes (excluding all k-mers that did not span the mutation site) to the patient’s HLA-I by NetMHCPan4.1, and selected 27mers containing at least one neoepitope predicted to be a strong binder (as per NetMHCPan4.1) or with a binding affinity27 <150 nM. We then designed 2–4 OLPs (Genscript) covering the mutated 27mer and performed in vitro peptide stimulations of bulk PBMCs as described above.We analysed PBMCs and transduced T cells on a FACS LSR Fortessa (BD Biosciences) using FACSDiva software (version 8.0.1, BD Bioscience). We stained cells for cell surface and intracellular markers using antibody cocktails per manufacturer’s recommendations, in a final staining volume of 100 µl, with appropriate controls as indicated. We used the following antibodies and reagents: from BioLegend, CD137 (clone 4B4-1, PE; 3 µl per sample), CD3 (clone SK7, PE-Cy7; 4 µl per sample), CD4 (clone OKT4, Brilliant Violet 650; 2 µl per sample), CD45 (clone 2D1, Alexa Fluor 700; 5 µl per sample), CD56 (clone HCD56, BV605; 2 µl per sample), CD8 (clone SK1, AF700 and APC-Cy7; both 2 µl per sample), HLA_ABC (clone W6/32, APC; 3 µl per sample), IFNγ (clone 4S.B3, BV421; 5 µl per sample), and mTCR (clone H57-597, PE-Cy5; 0.5 µl per sample); from BD Biosciences, CD107a (clone H4A3, PE; 20 µl per sample), CD56 (clone NCAM16.2, BV786; 5 µl per sample), TNFα (clone Mab11, APC; 2.5 µl per sample), and DAPI (564907; 0.2 µl per sample); and from Invitrogen, fixable viability Dye eFluor 520 (65-0867-14; 1.0 µl per sample). We used the following definitions: human T cells as live, CD45+CD56−CD3+ cells; degranulating CD8+ T cells as live, CD56−CD3+CD8+CD107a+; neopeptide-stimulated CD8+ T cells as live, CD56−CD3+CD8+TNFα+IFNγ+; and activated transduced T cells as live, CD3+CD8+mTCR+4-1BB+. We sorted T cells using an Aria Cell sorter (BD Biosciences). We analysed the data using FlowJo (version 10).In vitro neoantigen-specific T cell clones were identified as previously described1 with minor modifications. In brief, to determine if a T cell clone was specifically stimulated by a neopeptide pool, we sort-purified T cell clones into activated and inactivated fractions (CD107a+ and CD107a−) after peptide stimulation for either TCR Vβ or single-cell VDJ sequencing.To identify antigen-specific T cell clones, we determined a peptide-specificity stimulation P value for each T cell clone using a one-tailed binomial test (implementing the scipy.stats.binom_test) with a threshold S, to indicate significance with respect to at least S fraction of a clone being antigen-activated. We set the threshold such that no expanded T cell clones were detected in the control (DMSO) PBMCs for the experiment, by sweeping all thresholds from 0 to 1 with steps of 0.1. The minimum threshold which gave no expansion in each DMSO control was selected and an extra step of 0.1 was then added to enforce higher specificity of the expanded clones identified in the experiment. We defined clones based on the nucleotide sequence of the TRB junction. We adjusted P values using Bonferroni correction and determined significance at an adjusted P value threshold of <0.001.Sample sizes (n) represent the number of patients, samples, clones or cells. We analysed survival curves by log-rank (Mantel–Cox) test, compared two groups using unpaired two-tailed Mann–Whitney test, paired groups with two-tailed paired t-test or two-tailed Wilcoxon matched-pairs signed rank test, multiple groups with Kruskal–Wallis test, categorical variables by chi-squared test, and correlated parameters with Spearman correlation. We compared longitudinal clonal expansion by two-tailed Fisher’s exact test, and in vitro clonal activation by binomial test with Bonferroni correction. For differential gene-expression analysis, we used Wilcoxon rank sum without any multiple hypothesis correction. P < 0.05 was considered statistically significant. All analyses were performed using GraphPad Prism (version 10.1.1) or Python (version 3.11.6).Further information on research design is available in the Nature Portfolio Reporting Summary linked to this article.All single-cell sequencing data are available at the Gene Expression Omnibus under accession number GSE222011. All experimental source data are provided. Per institutional data sharing policies, requests for deidentified individual participant data can be made beginning 12 months after publication and for up to 36 months post-publication. Deidentified individual participant data reported in the manuscript will be shared under the terms of a Data Use Agreement that addresses the privacy and security requirements for safeguarding the data under HIPAA and MSK policies, and may only be used for approved proposals. Requests may be made to the corresponding author. Source data are provided with this paper.Code for CloneTrack is available at https://github.com/zsethna/CloneTrack. Code for PhenoTrack is available at https://github.com/zsethna/PhenoTrack. Code to identify GLIPH2 metaclones is available at http://50.255.35.37:8080/tools.Rojas, L. A. et al. Personalized RNA neoantigen vaccines stimulate T cells in pancreatic cancer. Nature 618, 144–150 (2023).Article
ADS
CAS
PubMed
PubMed Central
MATH
Google Scholar
Neoptolemos, J. P. et al. Adjuvant chemotherapy with fluorouracil plus folinic acid vs gemcitabine following pancreatic cancer resection: a randomized controlled trial. JAMA 304, 1073–1081 (2010).Article
CAS
PubMed
MATH
Google Scholar
Uesaka, K. et al. Adjuvant chemotherapy of S-1 versus gemcitabine for resected pancreatic cancer: a phase 3, open-label, randomised, non-inferiority trial (JASPAC 01). Lancet 388, 248–257 (2016).Article
CAS
PubMed
MATH
Google Scholar
Neoptolemos, J. P. et al. Comparison of adjuvant gemcitabine and capecitabine with gemcitabine monotherapy in patients with resected pancreatic cancer (ESPAC-4): a multicentre, open-label, randomised, phase 3 trial. Lancet 389, 1011–1024 (2017).Article
CAS
PubMed
Google Scholar
Murugan, A., Mora, T., Walczak, A. M. & Callan, C. G. Statistical inference of the generation probability of T-cell receptors from sequence repertoires. Proc. Natl Acad. Sci. USA 109, 16161–16166 (2012).Article
ADS
CAS
PubMed
PubMed Central
Google Scholar
Glanville, J. et al. Identifying specificity groups in the T cell receptor repertoire. Nature 286, 958 (2017).MATH
Google Scholar
Sallusto, F., Lanzavecchia, A., Araki, K. & Ahmed, R. From vaccines to memory and back. Immunity 33, 451–463 (2010).Article
CAS
PubMed
PubMed Central
Google Scholar
Gebhardt, T., Park, S. L. & Parish, I. A. Stem-like exhausted and memory CD8+ T cells in cancer. Nat. Rev. Cancer 23, 780–798 (2023).Article
CAS
PubMed
MATH
Google Scholar
Buggert, M., Price, D. A., Mackay, L. K. & Betts, M. R. Human circulating and tissue-resident memory CD8+ T cells. Nat. Immunol. 24, 1076–1086 (2023).Article
CAS
PubMed
Google Scholar
Fonseca, R. et al. Developmental plasticity allows outside-in immune responses by resident memory T cells. Nat. Immunol. 21, 412–421 (2020).Article
CAS
PubMed
PubMed Central
MATH
Google Scholar
Park, S. L. et al. Tissue-resident memory CD8+ T cells promote melanoma–immune equilibrium in skin. Nature 565, 366–371 (2019).Article
ADS
CAS
PubMed
MATH
Google Scholar
Mackay, L. K. et al. Hobit and Blimp1 instruct a universal transcriptional program of tissue residency in lymphocytes. Science 352, 459–463 (2016).Article
ADS
CAS
PubMed
MATH
Google Scholar
Milner, J. J. et al. Runx3 programs CD8+ T cell residency in non-lymphoid tissues and tumours. Nature 552, 253–257 (2017).Article
ADS
CAS
PubMed
PubMed Central
MATH
Google Scholar
Carlson, C. M. et al. Kruppel-like factor 2 regulates thymocyte and T-cell migration. Nature 442, 299–302 (2006).Article
ADS
CAS
PubMed
MATH
Google Scholar
Crowl, J. T. et al. Tissue-resident memory CD8+ T cells possess unique transcriptional, epigenetic and functional adaptations to different tissue environments. Nat. Immunol. 23, 1121–1131 (2022).Article
CAS
PubMed
PubMed Central
MATH
Google Scholar
Kragten, N. A. M. et al. Blimp‐1 induces and Hobit maintains the cytotoxic mediator granzyme B in CD8 T cells. Eur. J. Immunol. 48, 1644–1662 (2018).Article
CAS
PubMed
MATH
Google Scholar
Chen, J. et al. NR4A transcription factors limit CAR T cell function in solid tumours. Nature 567, 530–534 (2019).Article
ADS
CAS
PubMed
PubMed Central
MATH
Google Scholar
Wheeler, B. D. et al. The lncRNA Malat1 inhibits miR-15/16 to enhance cytotoxic T cell activation and memory cell formation. eLife 12, RP87900 (2023).Article
CAS
PubMed
PubMed Central
Google Scholar
Wakim, L. M., Gupta, N., Mintern, J. D. & Villadangos, J. A. Enhanced survival of lung tissue-resident memory CD8+ T cells during infection with influenza virus due to selective expression of IFITM3. Nat. Immunol. 14, 238–245 (2013).Article
CAS
PubMed
Google Scholar
Ostkamp, P. et al. A single-cell analysis framework allows for characterization of CSF leukocytes and their tissue of origin in multiple sclerosis. Sci. Transl. Med. 14, eadc9778 (2022).Article
CAS
PubMed
MATH
Google Scholar
Giles, J. R., Globig, A.-M., Kaech, S. M. & Wherry, E. J. CD8+ T cells in the cancer-immunity cycle. Immunity 56, 2231–2253 (2023).Article
CAS
PubMed
PubMed Central
Google Scholar
Siegel, R. L., Miller, K. D., Wagle, N. S. & Jemal, A. Cancer statistics, 2023. Ca. Cancer J. Clin. 73, 17–48 (2023).Article
PubMed
Google Scholar
Akondy, R. S. et al. Origin and differentiation of human memory CD8 T cells after vaccination. Nature 552, 362–367 (2017).Article
ADS
CAS
PubMed
PubMed Central
MATH
Google Scholar
Marraco, S. A. F. et al. Long-lasting stem cell–like memory CD8+ T cells with a naïve-like profile upon yellow fever vaccination. Sci. Transl. Med. 7, 282ra48 (2015).
Google Scholar
Balachandran, V. P. et al. Identification of unique neoantigen qualities in long-term survivors of pancreatic cancer. Nature 551, 512–516 (2017).Article
ADS
CAS
PubMed
PubMed Central
MATH
Google Scholar
Kranz, L. M. et al. Systemic RNA delivery to dendritic cells exploits antiviral defence for cancer immunotherapy. Nature 534, 396–401 (2016).Article
ADS
PubMed
MATH
Google Scholar
Hu, Z. et al. Personal neoantigen vaccines induce persistent memory T cell responses and epitope spreading in patients with melanoma. Nat. Med. 27, 515–525 (2021).Article
CAS
PubMed
PubMed Central
MATH
Google Scholar
Łuksza, M. et al. Neoantigen quality predicts immunoediting in survivors of pancreatic cancer. Nature 606, 389–395 (2022).Article
ADS
PubMed
PubMed Central
Google Scholar
Sahin, U. et al. BNT162b2 vaccine induces neutralizing antibodies and poly-specific T cells in humans. Nature 595, 572–577 (2021).Article
ADS
CAS
PubMed
MATH
Google Scholar
Sahin, U. et al. Personalized RNA mutanome vaccines mobilize poly-specific therapeutic immunity against cancer. Nature 547, 222–226 (2017).Article
ADS
CAS
PubMed
Google Scholar
Holtkamp, S. et al. Modification of antigen-encoding RNA increases stability, translational efficacy, and T-cell stimulatory capacity of dendritic cells. Blood 108, 4009–4017 (2006).Article
CAS
PubMed
MATH
Google Scholar
Kreiter, S. et al. Mutant MHC class II epitopes drive therapeutic immune responses to cancer. Nature 520, 692–696 (2015).Article
ADS
CAS
PubMed
PubMed Central
MATH
Google Scholar
Robins, H. et al. Ultra-sensitive detection of rare T cell clones. J Immunol Methods 375, 14–19 (2012).Article
CAS
PubMed
MATH
Google Scholar
Carlson, C. S. et al. Using synthetic templates to design an unbiased multiplex PCR assay. Nat. Commun. 4, 2680 (2013).Article
ADS
PubMed
MATH
Google Scholar
Huang, H., Wang, C., Rubelt, F., Scriba, T. J. & Davis, M. M. Analyzing the Mycobacterium tuberculosis immune response by T-cell receptor clustering with GLIPH2 and genome-wide antigen screening. Nat. Biotechnol. 38, 1194–1202 (2020).Article
CAS
PubMed
PubMed Central
Google Scholar
Wolf, F. A., Angerer, P. & Theis, F. J. SCANPY: large-scale single-cell gene expression data analysis. Genome Biol. 19, 15 (2018).Article
PubMed
PubMed Central
MATH
Google Scholar
Ceglia, N. et al. TCRi: Information theoretic metrics for single cell RNA and TCR sequencing in cancer. Preprint at bioRxiv https://doi.org/10.1101/2022.10.01.510457 (2022).Ceglia, N. et al. Identification of transcriptional programs using dense vector representations defined by mutual information with GeneVector. Nat. Commun. 14, 4400 (2023).Article
ADS
CAS
PubMed
PubMed Central
MATH
Google Scholar
Pedregosa, F. et al. Scikit-learn: machine learning in Python. Preprint at arXiv https://doi.org/10.48550/arxiv.1201.0490 (2012).Sethna, Z., Elhanati, Y., Callan, C. G., Walczak, A. M. & Mora, T. OLGA: fast computation of generation probabilities of B- and T-cell receptor amino acid sequences and motifs. Bioinformatics 35, btz035- (2019).Article
Google Scholar
Marcou, Q., Mora, T. & Walczak, A. M. High-throughput immune repertoire analysis with IGoR. Nat. Commun. 9, 561 (2018).Article
ADS
PubMed
PubMed Central
MATH
Google Scholar
Travaglini, K. J. et al. A molecular cell atlas of the human lung from single-cell RNA sequencing. Nature 587, 619–625 (2020).Article
ADS
CAS
PubMed
PubMed Central
MATH
Google Scholar
Li, H. Aligning sequence reads, clone sequences and assembly contigs with BWA-MEM. Preprint at arXiv https://doi.org/10.48550/arxiv.1303.3997 (2013).McKenna, A. et al. The Genome Analysis Toolkit: a MapReduce framework for analyzing next-generation DNA sequencing data. Genome Res. 20, 1297–1303 (2010).Article
CAS
PubMed
PubMed Central
MATH
Google Scholar
Cibulskis, K. et al. Sensitive detection of somatic point mutations in impure and heterogeneous cancer samples. Nat. Biotechnol. 31, 213–219 (2013).Article
CAS
PubMed
PubMed Central
MATH
Google Scholar
Saunders, C. T. et al. Strelka: accurate somatic small-variant calling from sequenced tumor–normal sample pairs. Bioinformatics 28, 1811–1817 (2012).Article
CAS
PubMed
MATH
Google Scholar
Deshwar, A. G. et al. PhyloWGS: reconstructing subclonal composition and evolution from whole-genome sequencing of tumors. Genome Biol. 16, 35 (2015).Article
PubMed
PubMed Central
Google Scholar
Download referencesThe authors thank patients and their families for partaking in this clinical trial and for donating tissues for research. We acknowledge all the clinical research staff of the Hepatopancreatobiliary Service, the Precision Pathology Biobanking Center, and the Center for Molecular Oncology at MSK. This work was supported in part by The Olayan Charitable Foundation and The Tow Foundation, and by a Stand Up to Cancer Convergence Award (to B.D.G. and V.P.B.), the NIH U01 CA224175 Pancreatic Cancer Microenvironment Network Cancer Moonshot Award (to V.P.B.), the Ben and Rose Cole Charitable PRIA Foundation (to V.P.B), the Mark Foundation ASPIRE Award (to B.D.G.), William H. Goodwin and Alice Goodwin and the Commonwealth Foundation for Cancer Research and The Center for Experimental Therapeutics at MSK (to V.P.B. and B.D.G.), the Center for Experimental Immuno-Oncology of MSK (to P.G.) and the American-Italian Cancer Foundation Post-Doctoral Research Fellowship (to M.M.). Services of the Integrated Genomics Core were funded by the NCI Cancer Center Support Grant (CCSG, P30 CA08748), Cycle for Survival and the Marie-Josée and Henry R. Kravis Center for Molecular Oncology. The team at MSK sponsored the clinical trial. The project was supported by the imCORE Network, Genentech, BioNTech, Stand Up To Cancer, the Lustgarten Foundation and the National Cancer Institute Pancreatic Cancer Microenvironment Network.These authors contributed equally: Zachary Sethna, Pablo GuaspThese authors jointly supervised this work: Benjamin D. Greenbaum, Vinod P. BalachandranImmuno-Oncology Service, Human Oncology and Pathogenesis Program, Memorial Sloan Kettering Cancer Center, New York, NY, USAZachary Sethna, Pablo Guasp, Charlotte Reiche, Martina Milighetti, George Payne, Luis A. Rojas, Akihiro Ohmoto, Masataka Amisaki, Abderezak Zebboudj, Zagaa Odgerel, Emmanuel M. Bruno, Siqi Linsey Zhang, Charlotte Cheng & Vinod P. BalachandranHepatopancreatobiliary Service, Department of Surgery, Memorial Sloan Kettering Cancer Center, New York, NY, USAZachary Sethna, Pablo Guasp, Charlotte Reiche, Martina Milighetti, George Payne, Luis A. Rojas, Nan Pang, Akihiro Ohmoto, Masataka Amisaki, Abderezak Zebboudj, Zagaa Odgerel, Emmanuel M. Bruno, Siqi Linsey Zhang, Charlotte Cheng, Alice C. Wei, Michael I. D’Angelica, T. Peter Kingham, Kevin C. Soares, William R. Jarnagin, Jeffrey Drebin & Vinod P. BalachandranThe Olayan Center for Cancer Vaccines, Memorial Sloan Kettering Cancer Center, New York, NY, USAZachary Sethna, Erin Patterson, Jayon Lihm, Benjamin D. Greenbaum & Vinod P. BalachandranComputational Oncology Service, Department of Epidemiology and Biostatistics, Memorial Sloan Kettering Cancer Center, New York, NY, USAZachary Sethna, Martina Milighetti, Nicholas Ceglia, Jayon Lihm, Olga Lyudovyk, Yuval Elhanati & Benjamin D. GreenbaumBioNTech, Mainz, GermanyEvelyna Derhovanessian, Luisa Manning, Felicitas Müller, Ugur Sahin & Özlem TüreciGenentech, San Francisco, CA, USAIna Rhee, Mahesh Yadav & Ira MellmanMeyer Cancer Center, Weill Cornell Medicine, Weill Cornell Medical College, New York, NY, USATaha Merghoub & Jedd D. WolchokDepartment of Pathology, Memorial Sloan Kettering Cancer Center, New York, NY, USAOlca BasturkDepartment of Epidemiology and Biostatistics, Memorial Sloan Kettering Cancer Center, New York, NY, USAMithat GönenDepartment of Medicine, Memorial Sloan Kettering Cancer Center, New York, NY, USAAndrew S. Epstein, Parisa Momtaz, Wungki Park, Ryan Sugarman, Anna M. Varghese, Elizabeth Won, Avni Desai & Eileen M. O’ReillyDavid M. Rubenstein Center for Pancreatic Cancer Research, Memorial Sloan Kettering Cancer Center, New York, NY, USAWungki Park, Alice C. Wei, Michael I. D’Angelica, T. Peter Kingham, Kevin C. Soares, William R. Jarnagin, Jeffrey Drebin, Eileen M. O’Reilly & Vinod P. BalachandranHI-TRON, Helmholtz Institute for Translational Oncology, Mainz, GermanyUgur Sahin & Özlem TüreciPhysiology, Biophysics and Systems Biology, Weill Cornell Medicine, Weill Cornell Medical College, New York, NY, USABenjamin D. GreenbaumYou can also search for this author in
PubMed Google ScholarYou can also search for this author in
PubMed Google ScholarYou can also search for this author in
PubMed Google ScholarYou can also search for this author in
PubMed Google ScholarYou can also search for this author in
PubMed Google ScholarYou can also search for this author in
PubMed Google ScholarYou can also search for this author in
PubMed Google ScholarYou can also search for this author in
PubMed Google ScholarYou can also search for this author in
PubMed Google ScholarYou can also search for this author in
PubMed Google ScholarYou can also search for this author in
PubMed Google ScholarYou can also search for this author in
PubMed Google ScholarYou can also search for this author in
PubMed Google ScholarYou can also search for this author in
PubMed Google ScholarYou can also search for this author in
PubMed Google ScholarYou can also search for this author in
PubMed Google ScholarYou can also search for this author in
PubMed Google ScholarYou can also search for this author in
PubMed Google ScholarYou can also search for this author in
PubMed Google ScholarYou can also search for this author in
PubMed Google ScholarYou can also search for this author in
PubMed Google ScholarYou can also search for this author in
PubMed Google ScholarYou can also search for this author in
PubMed Google ScholarYou can also search for this author in
PubMed Google ScholarYou can also search for this author in
PubMed Google ScholarYou can also search for this author in
PubMed Google ScholarYou can also search for this author in
PubMed Google ScholarYou can also search for this author in
PubMed Google ScholarYou can also search for this author in
PubMed Google ScholarYou can also search for this author in
PubMed Google ScholarYou can also search for this author in
PubMed Google ScholarYou can also search for this author in
PubMed Google ScholarYou can also search for this author in
PubMed Google ScholarYou can also search for this author in
PubMed Google ScholarYou can also search for this author in
PubMed Google ScholarYou can also search for this author in
PubMed Google ScholarYou can also search for this author in
PubMed Google ScholarYou can also search for this author in
PubMed Google ScholarYou can also search for this author in
PubMed Google ScholarYou can also search for this author in
PubMed Google ScholarYou can also search for this author in
PubMed Google ScholarYou can also search for this author in
PubMed Google ScholarYou can also search for this author in
PubMed Google ScholarYou can also search for this author in
PubMed Google ScholarYou can also search for this author in
PubMed Google ScholarYou can also search for this author in
PubMed Google ScholarYou can also search for this author in
PubMed Google ScholarAuthor contributions (including J.D.W., T.M., N.P., O.B., A.S.E., P.M., W.P., R.S., A.M.V., E.W., A.D., A.C.W., M.I.D., T.P.K., K.C.S., J.D. and W.R.J.) to the clinical trial are previously reported1. Z.S. and M.M. performed all clonal computational analyses. P.G. and C.R. performed all immunologic assays with assistance from G.P., L.A.R., A.O., M.A., A.Z., Z.O., E.M.B., S.L.Z. and C.C. Z.S. and N.C. performed all single-cell analyses. J.L. and Z.S. performed the clone reconstructions and phylogeny. M.M., O.L. and Y.E. performed metaclone analyses. The BioNTech team (E.D., F.M., L.M., U.S. and Ö.T.), coordinated by F.M., selected the neoantigens, designed and manufactured the individualized mRNA vaccines. M.G. provided statistical oversight. V.P.B. and E.M.O. oversaw all aspects of clinical trial conduct as primary and co-primary investigators, respectively. B.D.G. supervised the computational work. All data were collected and analysed at MSK, with interpretation and critical feedback from all authors (Z.S., P.G., C.R., M.M., N.C., E.P., J.L., G.P., O.L., L.A.R., N.P., A.O., M.A., A.Z., Z.O., E.M.B., S.L.Z., C.C., Y.E., E.D., L.M., F.M., I.R., M.Y., T.M., J.D.W., O.B., M.G., A.S.E., P.M., W.P., R.S., A.M.V., E.W., A.D., A.C.W., M.I.D., T.P.K., K.C.S., W.R.J., J.D., E.M.O., I.M., U.S., Ö.T., B.D.G., and V.P.B.). Z.S., P.G., C.R., M.M., E.P., E.D., L.M., F.M., I.R., M.Y., I.M., U.S., Ö.T., B.D.G. and V.P.B. participated in critical discussions and manuscript writing. B.D.G. supervised the computational work. V.P.B. supervised and coordinated all aspects of the project. The funders had no role in the conduct of the trial or endpoint analyses. The authors assume responsibility for the completeness and accuracy of the data and for the fidelity of the trial to the protocol and statistical analysis plan.Correspondence to
Vinod P. Balachandran.L.A.R., Z.M.S., B.D.G. and V.P.B. are inventors on patent applications related to work on antigen cross-reactivity and tracking vaccine-induced T cell clones. B.D.G. and V.P.B. are inventors on a patent application on neoantigen quality modelling. L.A.R. is an inventor of a patent related to oncolytic viral therapy. B.D.G. has received honoraria for speaking engagements from Merck, Bristol Meyers Squibb and Chugai Pharmaceuticals; has received research funding from Bristol Meyers Squibb, Merck and ROME Therapeutics; and has been a compensated consultant for Darwin Health, Merck, PMV Pharma, Shennon Biotechnologies, Synteny and Rome Therapeutics of which he is a co-founder. V.P.B. reports honoraria and research support from Genentech and research support from Bristol-Myers Squibb. A.S.E received royalties from Up-To-Date. A.V. reports research funding from Lilly, Verastem, BioMed Valley Discoveries, Bristol-Myers Squibb and Silenseed. A.C.W. reports the following: Histosonics, consulting and Ipsen, clinical trial funding. E.M.O. reports research funding to the institution from: Genentech/Roche, BioNTech, AstraZeneca, Arcus, Elicio, Parker Institute, NIH/NCI, Digestive Care and Break Through Cancer; consulting via Data and Safety Monitoring Board (DSMB) for: Arcus, Alligator, Agenus, BioNTech, Ipsen, Merck, Moma Therapeutics, Novartis, Syros, Leap Therapeutics, Astellas, BMS, Fibrogen, Revolution Medicine, Merus Agios (spouse), Genentech-Roche (spouse), Eisai (spouse) and Servier (Spouse). J.D. owns stock in Alnylam Pharmaceuticals, Arrowroot Acquisition and Ionis Pharmaceuticals. T.M. is a co-founder and holds equity in IMVAQ Therapeutics; is a consultant for Immunos Therapeutics, ImmunoGenesis and Pfizer; has research support from Bristol-Myers Squibb, Surface Oncology, Kyn Therapeutics, Infinity Pharmaceuticals, Peregrine Pharmaceuticals, Adaptive Biotechnologies, Leap Therapeutics and Aprea; and has patents on applications related to work on oncolytic viral therapy, alphavirus-based vaccine, neoantigen modelling, CD40, GITR, OX40, PD-1 and CTLA-4. J.D.W. is a consultant for Apricity, CellCarta, Ascentage Pharma, AstraZeneca, Bicara Therapeutics, Boehringer Ingelheim, Bristol-Myers Squibb, Daiichi Sankyo, Dragonfly, Georgiamune, Imvaq, Larkspur, Psioxus, Recepta, Tizona and Sellas. J.D.W. receives grant and research support from Bristol-Myers Squibb and Sephora. J.D.W. has equity in Apricity, Arsenal IO, Ascentage, Imvaq, Linneaus, Georgiamune, Maverick and Tizona Therapeutics. W.P. reports research funding to institution from: Merck, Astellas, Miracogen and Amgen; consultancy or advisory board activity for: Astellas and EXACT Therapeutics; honoraria for Continuing Medical Education (CME) from: American Physician Institute and Integrity. O.T. and U.S. are co-founders, management board members and employees at BioNTech. E.D., L.M. and F.M. are employees at BioNTech. I.R., M.Y. and I.M. are employees at Genentech. The other authors declare no competing interests.Nature thanks Robert Seder, Neeha Zaidi and the other, anonymous, reviewer(s) for their contribution to the peer review of this work.Publisher’s note Springer Nature remains neutral with regard to jurisdictional claims in published maps and institutional affiliations.a, Trial schematic as previously reported1. Reproduced under CC BY 4.0: https://creativecommons.org/licenses/by/4.0/. b, Recurrence-free survival (RFS) from landmark time (last vaccine priming dose) stratified by autogene cevumeran (vaccine) immunologic response determined by ex vivo IFNγ ELISpot1 (left), and RFS from surgery stratified by anti-PD-L1 (atezolizumab) response (middle) and median primary tumour size (right). HR, hazard ratio with 95% confidence interval. Black tick marks, censorship points. n is the number of individual patients. P values by two-tailed log-rank test (b).a, b, Vaccine-induced T cell clones at prime (a) and boost (b) identified by CloneTrack. Patient 5 did not receive boost dose and is excluded from (b). Black, blue, green, yellow symbols indicate surgery, atezolizumab, vaccination, mFOLFIRINOX times, respectively. Horizontal line, clone detection threshold; vertical line, recurrence time. Line colour indicates adjusted P value for de novo expansion. n is the number of clones. P values by modified two-tailed Fisher’s exact test (a, b).Source Dataa-d, To identify neoantigen-specific T cell clones, we stimulated PBMCs at various timepoints post-vaccination in vitro with overlapping neopeptide pools. We then purified CD8+CD107a+/− T cells and identified clones with greater proportion of activated (CD107a+) versus inactivated (CD107a-) cells as in vitro neoantigen-specific T cell clones (NA specific) (as done previously1; Methods). For select clones and patients, we validated neoepitope specificity by TCR cloning (NA mapped). a, Assay schematic. b,c, Venn diagrams show overlap of CloneTrack clones (green Venn), NA-specific clones (clones identified as neoantigen-specific with in vitro vaccine neoantigen-specific T cell activation as in a, pink Venn) and NA-mapped clones (clones mapped to neoepitopes by TCR cloning as in a, black Venn) in individual (b) and all (c) n = 8 responders. Trajectory plots/Venn shading show in vivo longitudinal expansion/contraction of clones identified by CloneTrack and validated experimentally (blue shading in Venn diagrams), identified by CloneTrack but not experimentally validated (green shading in the Venn diagrams), and experimentally validated but not found by CloneTrack (pink shading in Venn diagrams). Flow cytometry (b) shows 4-1BB expression on neoantigen-specific TCR-transduced CD8+ T cells (identified as in a, NA mapped clones) cultured with HLA-matched, neo or irrelevant peptide-pulsed antigen-presenting cells. Cells were gated on live, CD3+CD8+ TCR-transduced cells. * Denotes CloneTrack- clones. (d) Percentage of NA-specific and NA-mapped clones (as in c) contained in tissues. Black, blue, green, and yellow symbols indicate surgery, atezolizumab, vaccination, and mFOLFIRINOX times, respectively. n is the number of clones.Source Dataa, Number of autogene cevumeran priming doses for CloneTrack clones (identified as in Extended Data Fig. 2a) to reach peak expansion in blood. Red line, median doses to reach peak expansion. b, Percentage of individual patient T cell repertoires represented by individual CloneTrack clones at peak expansion in (a). c, Longitudinal average number of all CloneTrack clone cells per million T cells in responders (n = 8) over time. Circles, mean; error bars, s.e.m. d, Peak expansion (top) and half-life (bottom) of CloneTrack clones post-prime and boost. e, (Top) Representative estimated trajectories post vaccine prime and boost. (Bottom) Root mean square error (RMSE) of exponential fits of estimated trajectories for each clone in each patient. Dashed lines denote where average estimated differences between observed and estimated measurements vary by a factor of 2 (red) or 10 (black). f, Correlation of vaccine-induced expansion peak frequency post-prime (top) and post-boost (bottom) with estimated lifespan (left) and half-life (right). g, CloneTrack clone half-life (top) and lifespan (bottom) with one or more co-expanded clones post-prime (left) and boost (right). h, CloneTrack clone half-life (top) and lifespan (bottom) post-prime (left) and boost (right) in monotope and polytope responders. i, Lifespan of CloneTrack clones stratified by mapped/unmapped neoantigen (NA) specificity in vitro (as in Extended Data Fig. 3a–c). In d-h, n = 8 patients post-prime and n = 7 patients post-boost (patient 5 no boost). n is the number of clones. P values by Kruskal-Wallis test (b), two-tailed Mann Whitney test (d, g, h) and two-tailed Spearman correlation (f).Source Dataa, Generation probability (Pgen) of CloneTrack clones that do/do not persist >2 years post-vaccination (persistent/non-persistent). b, Percentage of CloneTrack clones with intra-patient metaclones in shared TCR Vβ specificity groups. Metaclones were identified as clonotypes with TCR sequences similar to the vaccine-reactive clones (i.e., CloneTrack clones) using GLIPH2.035. c, Individual longitudinal trajectories of CloneTrack metaclones and aggregate CloneTrack clones for comparison. Black, blue, green, and yellow symbols indicate surgery, atezolizumab, vaccination, and mFOLFIRINOX times, respectively. n is the number of clones. P value by two-tailed Mann Whitney test (a).Source Dataa, Atezolizumab (anti-PD-L1)-induced T cell clones identified by CloneTrack in all vaccine responders. Horizontal line, clone detection threshold; red box, autogene cevumeran responders. Black, blue, green, and yellow indicate surgery, atezolizumab, vaccination and mFOLFIRINOX times, respectively. n is the number of clones. P values by modified two-tailed Fisher’s exact test.Source Dataa, UMAPs of single-cell RNA and TCR sequencing of all blood T cells (all patients, all times) stratified by patient (left), CloneTrack clones (middle) and CD8 expression (right). b-d, Violin plots of select central/effector memory (b), tissue retention (c) and T cell exhaustion (d) associated genes in CloneTrack clone T cells at expansion, contraction and memory phases by single-cell RNA/TCR sequencing as shown in Fig. 3a. n is the number of cells or clones. P values by two-sided pairwise Wilcoxon rank sum test.a, UMAPs of single-cell RNA and TCR sequencing of CloneTrack clone T cells (all patients, all times) stratified by patient (left) and phenotype (right). b, PhenoTrack plots of phenotype composition and conversion of CloneTrack clones over time in individual responders. Vertical coloured bars show the proportion of cells of each phenotype at corresponding times. Black, blue, green and yellow rectangles indicate surgery, atezolizumab, vaccination and mFOLFIRINOX times, respectively. c, Phenotype conversion of CloneTrack clones from expansion to contraction (top) and contraction to memory (bottom) phases in individual responders. Arrows, individual clones; axis proximity of arrow base, fraction of cells per clone in a phenotype; arrows point from phenotype origin to destination; arrow width, clone frequency. n is the number of cells.Source Dataa, b, Longitudinal cytokine production and lytic capacity (flow cytometry, left; colored curves, right) of CD8+ T cells post bulk PBMC in vitro rechallenge with immunodominant and sub-dominant ELISpot+ vaccine neoantigens, and aggregate fraction of autogene cevumeran-induced CloneTrack clones (black curves) in monotope (a) and polytope (b) responders. Flow cytometry is gated on live, CD3+CD56−CD8+ cells. Data for patients 10, 25 (cytokine production) and 11 (flow cytometry) are in Fig. 4a,b.Source Dataa, b, Longitudinal cytokine production of CD8+ and CD4+ T cells post bulk PBMC in vitro rechallenge with pools of non-vaccine tumor neoantigens depicting individual (a, flow cytometry) and aggregated (b) data in responders. Flow cytometry is gated on live, CD3+CD56−CD8+ cells (left) and on live, CD3+CD56−CD4+ cells (right).Source DataClinical trial protocol.Gating strategies.Differentially expressed genes in CloneTrack clones by phase.Open Access This article is licensed under a Creative Commons Attribution-NonCommercial-NoDerivatives 4.0 International License, which permits any non-commercial use, sharing, distribution and reproduction in any medium or format, as long as you give appropriate credit to the original author(s) and the source, provide a link to the Creative Commons licence, and indicate if you modified the licensed material. You do not have permission under this licence to share adapted material derived from this article or parts of it. The images or other third party material in this article are included in the article’s Creative Commons licence, unless indicated otherwise in a credit line to the material. If material is not included in the article’s Creative Commons licence and your intended use is not permitted by statutory regulation or exceeds the permitted use, you will need to obtain permission directly from the copyright holder. To view a copy of this licence, visit http://creativecommons.org/licenses/by-nc-nd/4.0/.Reprints and permissionsSethna, Z., Guasp, P., Reiche, C. et al. RNA neoantigen vaccines prime long-lived CD8+ T cells in pancreatic cancer.
Nature (2025). https://doi.org/10.1038/s41586-024-08508-4Download citationReceived: 05 April 2024Accepted: 10 December 2024Published: 19 February 2025DOI: https://doi.org/10.1038/s41586-024-08508-4Anyone you share the following link with will be able to read this content:Sorry, a shareable link is not currently available for this article.
Provided by the Springer Nature SharedIt content-sharing initiative
Advertisement
Nature (Nature)
ISSN 1476-4687 (online)
ISSN 0028-0836 (print)
© 2025 Springer Nature LimitedSign up for the Nature Briefing newsletter — what matters in science, free to your inbox daily.