The science of the “X-ray vision” that reveals the magma beneath Yellowstone – United States Geological Survey
An official website of the United States governmentHere’s how you know
Official websites use .gov
A .gov website belongs to an official government organization in the United States.
Secure .gov websites use HTTPS
A lock () or https:// means you’ve safely connected to the .gov website. Share sensitive information only on official, secure websites.
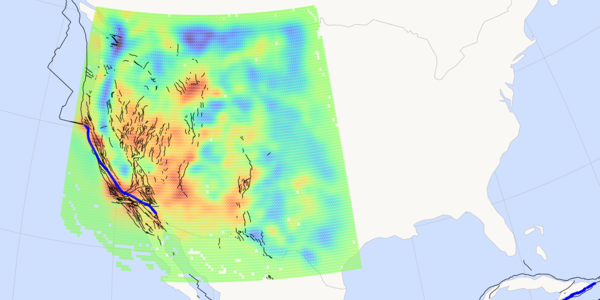
Latest Earthquakes | Chat Share Social Media A number of studies have given us fascinating images showing Yellowstone’s magma reservoirs. But how are those images created?Yellowstone Caldera Chronicles is a weekly column written by scientists and collaborators of the Yellowstone Volcano Observatory. This week’s contribution is from Scott K. Johnson, Science Communication Associate at EarthScope Consortium.Jeopardy is unique for its question-to-the-answer format, with contestants using a clue like “this animal starred in a 1975 Steven Spielberger film and can constantly regrow lost teeth” to correctly respond “what is a shark?” The geophysical techniques that allow us to image the magma beneath Yellowstone―as in a recent study that provided a view of multiple separate magma reservoirs― work similarly. These studies are often of great public interest, producing visuals that are (relatively) easy to understand. But how exactly do they work?Seeing below the surface is the realm of tomography―in medical imaging, the “CT” in “CT scan” stands for Computed Tomography―which can be done in several ways. The most common method uses shaking measured by seismometers to reveal variations in the physical properties of the Earth.The similarity to Jeopardy is that these techniques work backwards―what we call “inversion.” Because we can’t directly take a measuring tape underground and inspect a magma reservoir, we have to rely on the fact that this magma reservoir can affect measurements of other things, like seismic waves that pass through. If we knew exactly what was underground, we could pretty clearly predict its effect on the seismic waves reaching nearby seismometers. But instead, the inverse solution is to take the pattern of measured seismic waves and work backwards to find a plausible model of the conditions underground that would cause that pattern.It’s a bit like working out where a traffic jam is occurring in town based solely on how late each of your coworkers arrives home at the end of the workday. Knowing that they all left work at 5:15, and knowing which part of town each one was headed for, you could probably figure out where the slowdown is based on the fact that two people were delayed 15 minutes, one was delayed 5 minutes, and one experienced no delay at all.In fact, a common method of seismic tomography involves measuring the travel time for seismic waves from earthquakes and noting where they arrive at seismometers “late.” This allows us to map out regions of rock where seismic waves travel more quickly or more slowly. That information can then be turned into estimates of physical properties like temperature, rock type, density, or the presence (and amount) of magma. The more seismometers recording data and the more earthquakes that are measured, the better the resolution of the map.The same idea can be applied in other ways to seismic data. We can look at the details of the wiggles on the seismometer rather than just their arrival time, for example, seeing which areas of the Earth dampen the seismic waves and which ring like a bell. Or we can replace the earthquake with another source of shaking energy, like a truck-mounted piston that thumps the ground, the constant background din of a busy highway, or even the global noise created by ocean waves. Through different approaches, we can image something local, like a magma reservoir, or we can image the entire planet―this is how we know about the properties of the mantle, outer core, and inner core of the Earth.The recent image of Yellowstone’s magma system was created from yet another kind of data. Instead of using seismometers that measure shaking, magnetotelluric instruments were used to measure the electrical conductivity beneath the ground.The Sun’s energy and also lightning around the world induce electrical and magnetic fields within the Earth, but the strength of these fields varies from place to place depending on the conductivity of the material beneath the surface. And since measurements at different frequencies relate to the conductivity at different depths, we can collect quite a lot of information through magnetotelluric measurements. Magma has a much higher conductivity than solid rock, so the magnetotelluric technique is of obvious use around volcanoes.The inversion in the case of magnetotelluric data works out the 3-D pattern of conductivity underground that can explain the measurements made at the surface. And again, the more surface measurements you have close together, the more detailed the 3-D image becomes.All kinds of tomography have been employed at Yellowstone to give us a much richer understanding of the magma system that lies beneath the ground. Similar studies have been done at other volcanoes as well—like Mount St. Helens. Even on a much smaller scale, these techniques have been used to image the hot-water “plumbing” beneath individual geysers in Yellowstone, giving us insights into the reasons for their behavior.Permanent monitoring networks of instruments like seismometers around Yellowstone help make this possible―sometimes supplemented by temporary additions of even more instruments for higher-resolution imaging. The end result is a better understanding of what the system looks like beneath the surface, how it works, and how it may behave over time, which is critical to the mission of keeping people out of harm’s way―out of jeopardy, you might say.How can lightning and solar storms be used to map magma beneath Yellowstone? Through magnetotelluric imaging, which provides information about the…Data from a major deployment of seismometers in 2020 is revealing new insights into the characteristics of the magma chamber beneath Yellowstone…Steamboat Geyser has been wowing visitors to Yellowstone National Park since March 2018. Seismic studies of the geyser and nearby Cistern Spring are…How do we know what’s beneath Yellowstone, and how can we image the shallow magma?How can lightning and solar storms be used to map magma beneath Yellowstone? Through magnetotelluric imaging, which provides information about the…Data from a major deployment of seismometers in 2020 is revealing new insights into the characteristics of the magma chamber beneath Yellowstone…Steamboat Geyser has been wowing visitors to Yellowstone National Park since March 2018. Seismic studies of the geyser and nearby Cistern Spring are…How do we know what’s beneath Yellowstone, and how can we image the shallow magma?These items are in the RSS feed format (Really Simple Syndication) based on categories such as topics, locations, and more. You can install and RSS reader browser extension, software, or use a third-party service to receive immediate news updates depending on the feed that you have added. If you click the feed links below, they may look strange because they are simply XML code. An RSS reader can easily read this code and push out a notification to you when something new is posted to our site.Idaho NewsMontana NewsNatural Hazards NewsUnited States of America NewsVolcano Science Center NewsWyoming NewsYellowstone NewsYellowstone Volcano Observatory News1300 SE Cardinal Court STE 100
Vancouver, WA 98683
United States
Source: https://www.usgs.gov/observatories/yvo/news/science-x-ray-vision-reveals-magma-beneath-yellowstone